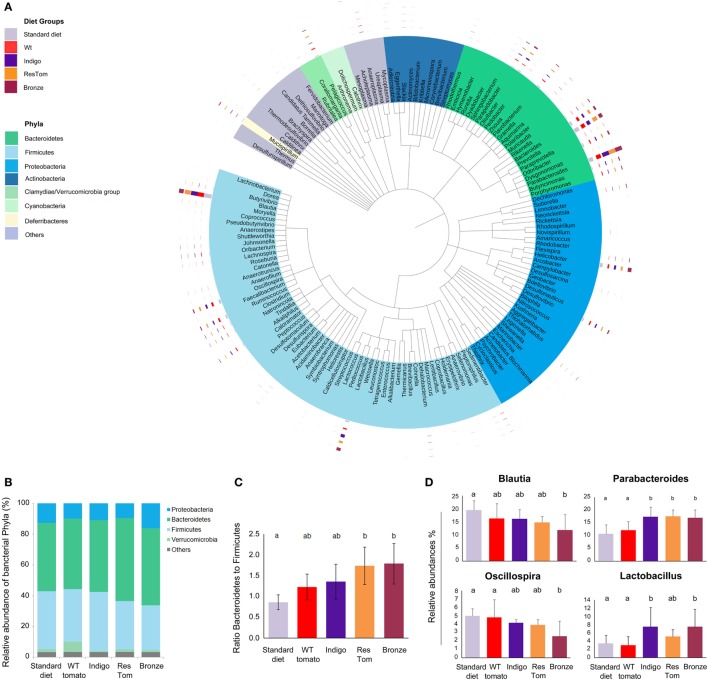
Figure 2.
Composition of the intestinal microbiota of mice fed diets enriched with different tomato fruit. Sex-matched mice (n = 5) were divided into five groups, based on the diet (standard diet and diets enriched with 1% of wild-type, Indigo, ResTom, and Bronze lyophilized tomato fruit). After 2 weeks diet, fecal samples were collected for the microbiota meta-analysis. (A) Circular representation of the phylogenetic tree showing the major 150 genera of the intestinal microbiota. The inner bands indicate the genera colored by phylum. The outer circles show multibar charts indicating the relative abundances of genera in different diet groups. (B) Relative abundances of the phyla found in the microbiome of mice in different diet groups. (C) Bacteroidetes/Firmicutes ratio in the microbiome of mice fed with different diets. (D) Relative abundances of the genera of the microbiome showing significant differences among diet groups. The letters above the histograms in panels (C) and (D) indicate the significant differences between two different diet groups assessed by Duncan’s multiple-range test.

