
Figure 10.
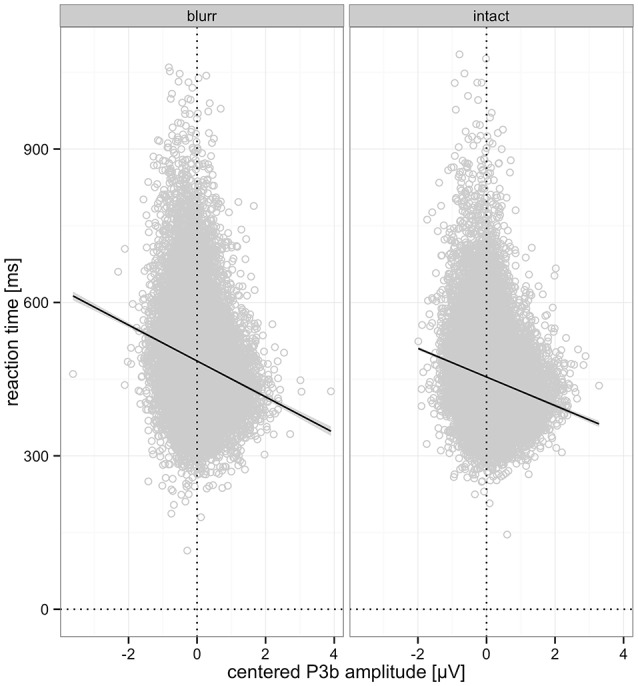
Relationship between centered P3b amplitude and RTs for blurred and intact stimuli. Predicted partial effects were computed with the remef package in R, the regression line is retrieved from a local linear model fit to the data points for illustration.