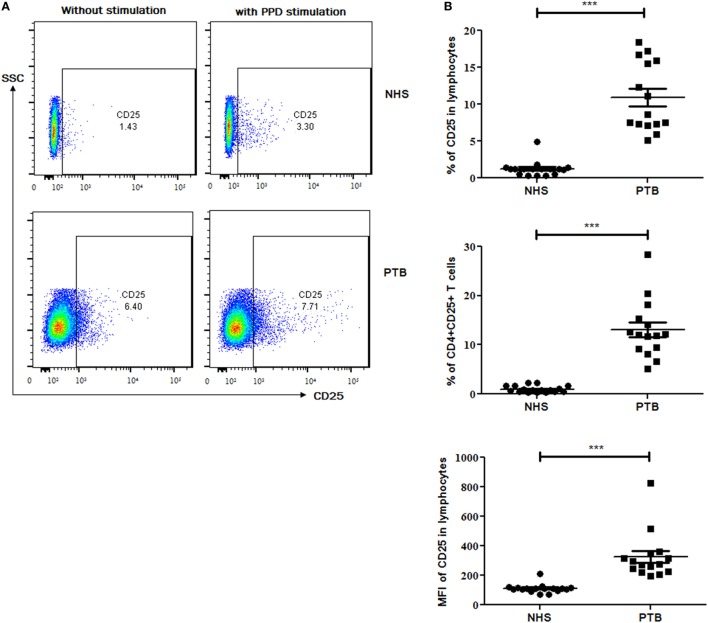
Figure 2.
Expression of CD25 marker and cellular subset in peripheral blood of NHS and treatment naïve PTB. (A) Flow-cytometry plots (on left) showing the expression of CD25 with and without PPD stimulation and (B) scattergrams (on right) between NHS and PTB for CD25 and CD4+CD25+ T cells. Statistical analysis was performed using Mann–Whitney U test. *p ≤ 0.05, **p ≤ 0.01, and ***p ≤ 0.001. NHS, normal healthy subjects; PTB, pulmonary tuberculosis patients; MFI, Mean fluorescence intensity.

