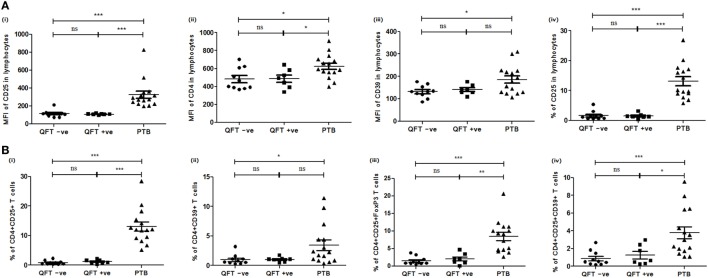
Figure 4.
Expression of various markers and cellular subsets in PBMCs of QFT –ve (NHS), QFT +ve (NHS), and PTB. (A) Mean fluorescent intensity (MFI) of (i) CD25, (ii) CD4, (iii) CD39 markers in lymphocytes, and (iv) percentage of CD25 T cells in lymphocytes. (B) Frequencies of (i) CD4+CD25+, (ii) CD4+CD39+ T cells, (iii) CD4+CD25+FoxP3, and (iv) CD4+CD25+CD39+ Treg. Statistical analysis was performed using Mann–Whitney U test *p ≤ 0.05, **p ≤ 0.01, and ***p ≤ 0.001. PBMCs, peripheral blood mononuclear cells; QFT, quantiferon; PTB, pulmonary TB patients; ns, not significant.

