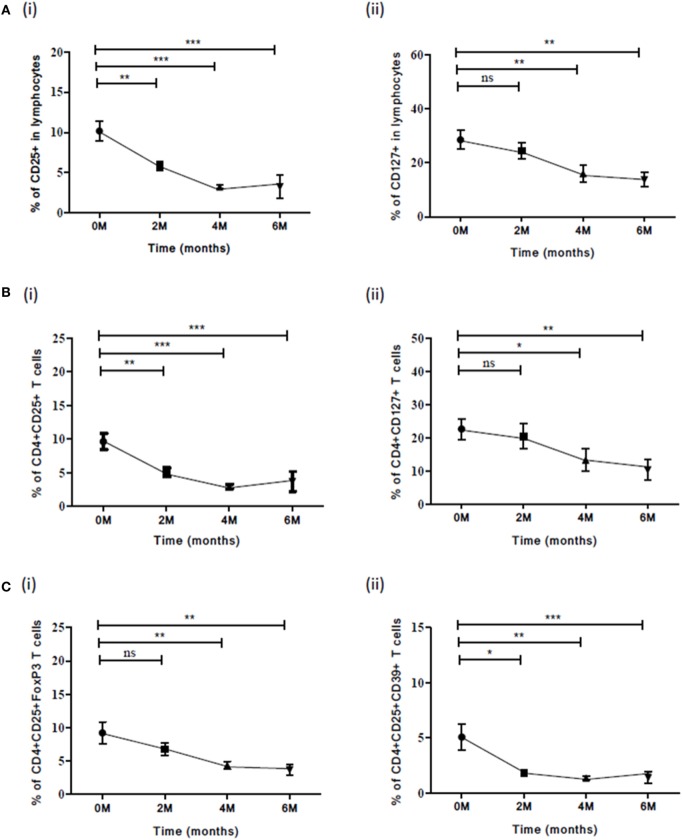
Figure 5.
Frequency of various Treg subsets and associated markers at different time points (0, 2, 4, and 6) of TB treatment. (A) Expression of (i) CD25 and (ii) CD127 in lymphocytes along with ATT. (B) Frequencies of (i) CD4+CD25+ and (ii) CD4+CD127+ T cells (C) Frequencies of Treg subsets: (i) CD4+CD25+FoxP3 and (ii) CD4+CD25+CD39+ during ATT. Statistical analysis was performed using Kruskal–Wallis non-parametric test and comparison between the different time points (0–2, 0–4, and 0–6) was made using Mann–Whitney U test. *p ≤ 0.05, **p ≤ 0.01, and ***p ≤ 0.001. M, months; ns, not significant; ATT, antituberculous treatment.

