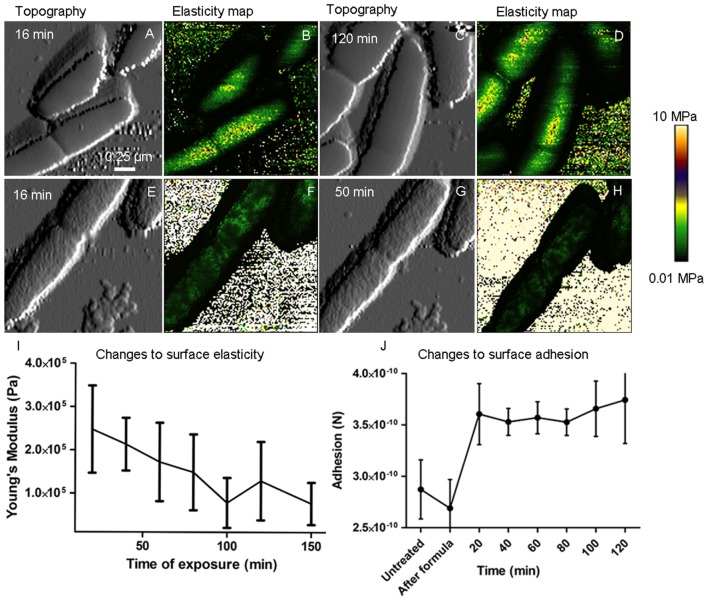
FIGURE 6.
Time lapse AFM-QITM images show inhibition of cell division, changes to cell elasticity and changes to surface adhesion. QITM elasticity maps of the surface of live E. coli show no significant change in envelope elasticity during normal cell division (B,D), however, there was a dramatic decrease in Young’s modulus after a 16 min exposure to 1 mM 2,4-D (F), which further decreased after 50 min (H). (A,C,E,G) Show corresponding topography. Plot (I) shows a decrease in elasticity as a function of time during 2,4-D exposure (p < 0.0001, n > 2000) and plot (J) shows a significant increase in adhesion (p < 0.0001, n > 2000) after 20 min, with no subsequent significant change.

