
Figure 8.
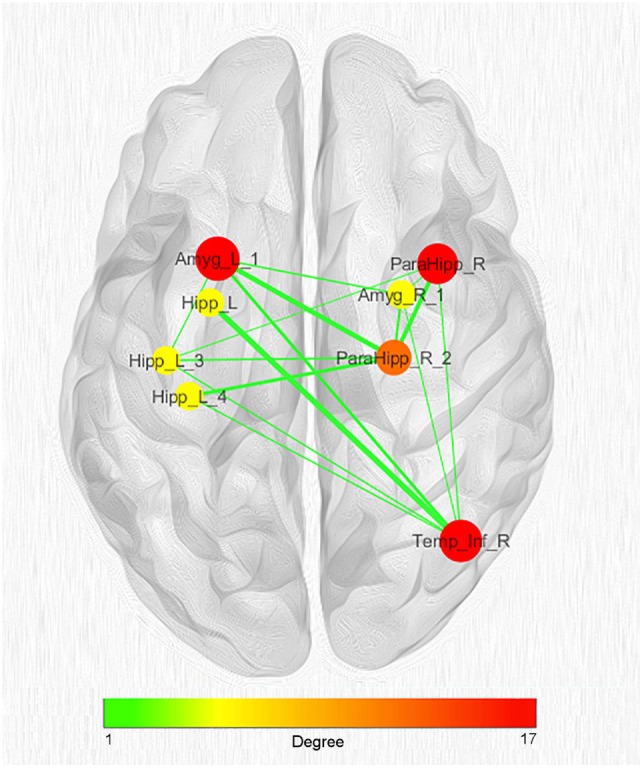
Network clustering with k-core decomposition algorithm. Colors and dimensions of nodes indicate their topological degree (smaller node = lower degree; from green to red = from lower to higher values). Thickness of edges indicate the degree of edge betweenness (smaller edge = lower degree). Both node degree and edge betweenness values refer to the original coatrophy network.