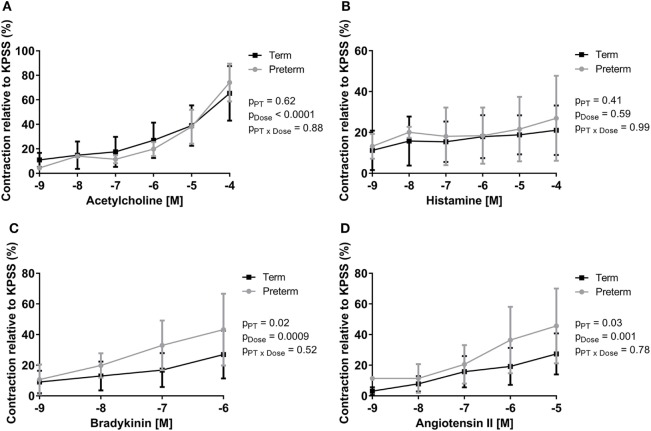
Figure 3.
Dose response curves showing peak contractility of preterm and term lamb ileums, relative to KPSS contractility, for acetylcholine (A), histamine (B), bradykinin (C), and angiotensin II (D). Data were analyzed using a two-way analysis of variance with the factors preterm birth (pPT), drug concentration (pDose), and their interaction (pPT × Dose).

