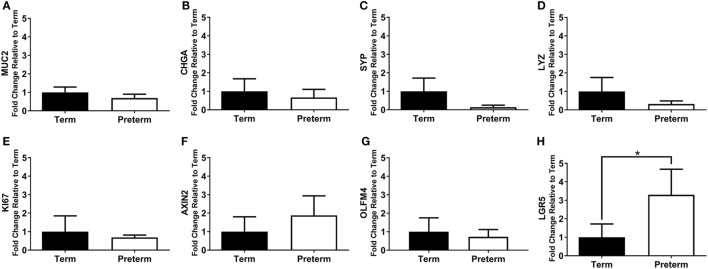
Figure 7.
qRT-PCR results, expressed as the fold change in mRNA expression relative to term controls, for the intestinal cell markers MUC2 (A), CHGA (B), SYP (C), LYZ (D), KI67 (E), axis inhibition protein 2 (AXIN2) (F), olfactomedin 4 (OLFM4) (G), and leucine-rich repeat-containing G-protein coupled receptor 5 (LGR5) (H). *p = 0.01.

