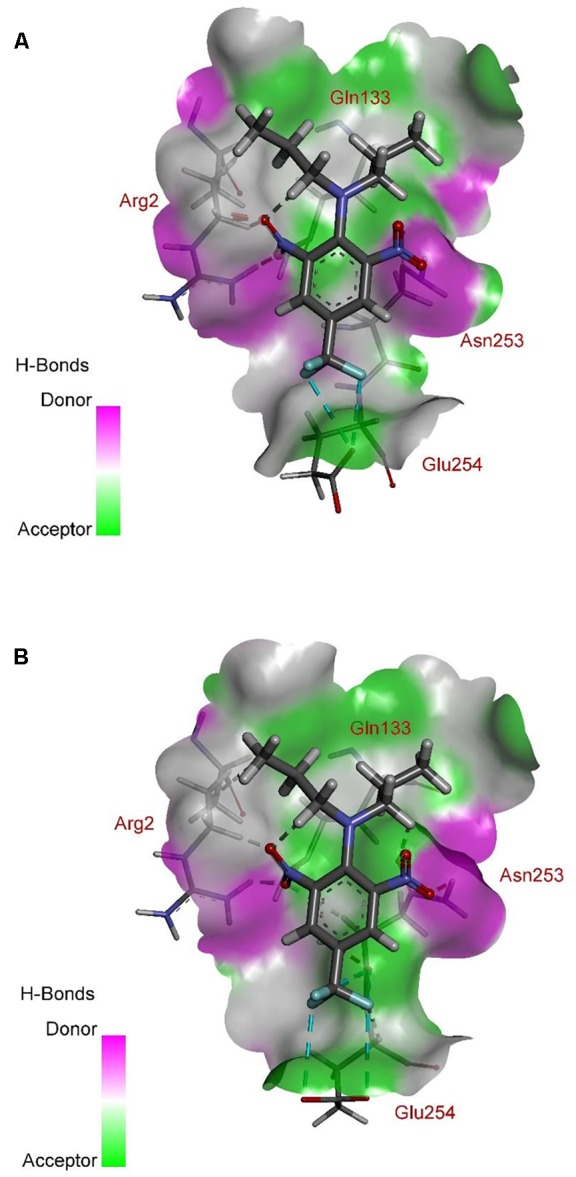
FIGURE 10.

Spatial structure of contact interface between trifluralin and the Arg-243-Met (A), and between trifluralin and the Arg-243-Lys (B) mutant α-tubulins. Protein contact surface is colored by H-bond donor/acceptor distribution, binding site amino acids represented by sticks, and intermolecular contacts indicated by dotted lines.
