FIGURE 3.

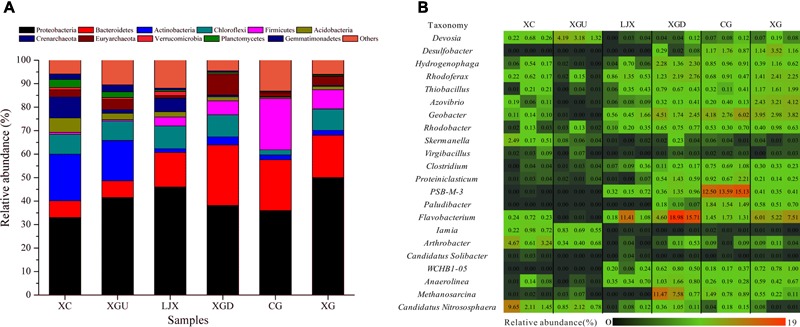
(A) Phylogenetic distributions of the phyla (% of total reads) present in different riparian soil samples. (B) Relative abundances of the 22 most dominant microbial genera for the six riparian sites.

(A) Phylogenetic distributions of the phyla (% of total reads) present in different riparian soil samples. (B) Relative abundances of the 22 most dominant microbial genera for the six riparian sites.