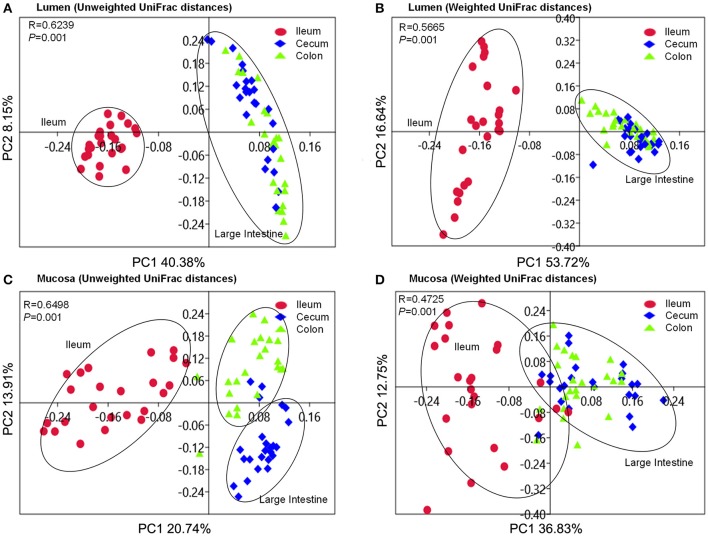
Figure 4.
PCoA plots based on unweighted and weighted UniFrac distances of luminal microbiome (A,B) as well as mucosa-attached microbiome (C,D). Respective ANOSIM R values showing the extent of community variation among different intestinal segments and statistical significance were indicated. Axes represent the two dimensions explaining the greatest proportion of variances in the communities for each analysis.

