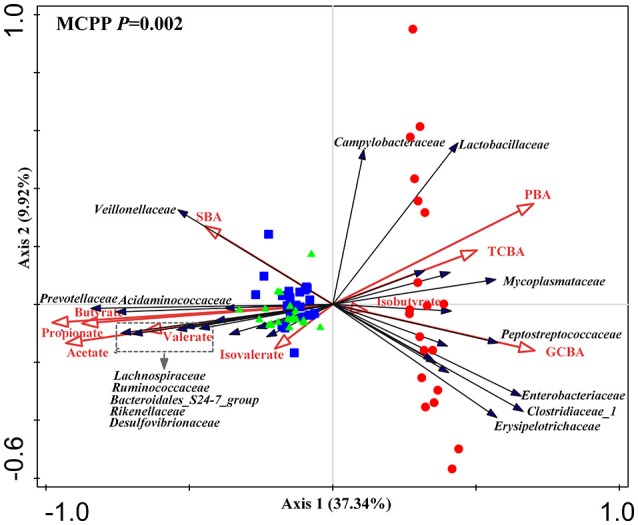
Figure 6.

Triplot of redundancy analysis (RDA) of the intestinal microbial composition at the family level relative to luminal bile acids and SCFAs. Only taxa with an average relative abundance ≥ 1% in at least one region were involved. Microbiota from the distal ileum, cecum and colon were indicated by red circles, blue square and green triangles, respectively. Constrained explanatory variables (primary bile acid, PBA; secondary bile acid, SBA; taurine-conjugated bile acid, TCBA; glycine-conjugated bile acid, GCBA; SCFAs including acetate, propionate, butyrate, valerate, isobutyrate and isovalerate) were indicated by red arrows. Responding taxa were indicated by black arrows and only those with highest fit in ordination plot were labeled. First and second coordinates were plotted, showing 37.34 and 9.92% of the total variability in the data set, respectively. Top-left, P-value was obtained by Monte Carlo permutation procedure (MCPP).
