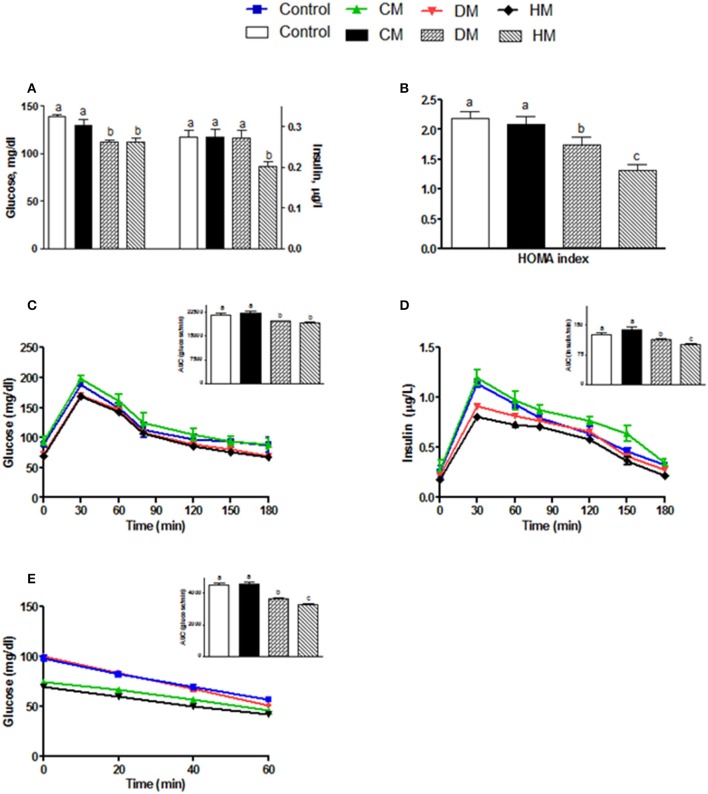
Figure 2.
Effects of oral administration of human, donkey and cow milk on glucose homeostasis. The graphs show the plasma levels of glucose and insulin (A), the Homa-index (B), the plasma glucose (C), and insulin (D) concentrations at different time points after glucose load, and insulin tolerance test (E). The histograms in (C–E), represent the area under curve (AUC) related to each condition. Data are presented as means ± SEM from n = 7 animals/group. Labeled means without a common letter differ (P < 0.05).

