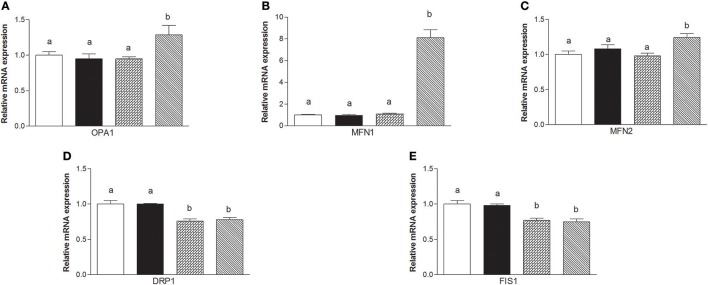
Figure 6.
Effects of oral administration of human, donkey, and cow milk on skeletal muscle mitochondrial dynamics. The graphs summarizing the results of real time PCR represent the relative levels of mRNAs for OPA1 (A), MFN1 (B), MNF2 (C), DRP1 (D), and FIS 1 (E). Data are presented as means ± SEM from n = 7 animals/group. Labeled means without a common letter differ (P < 0.05).

