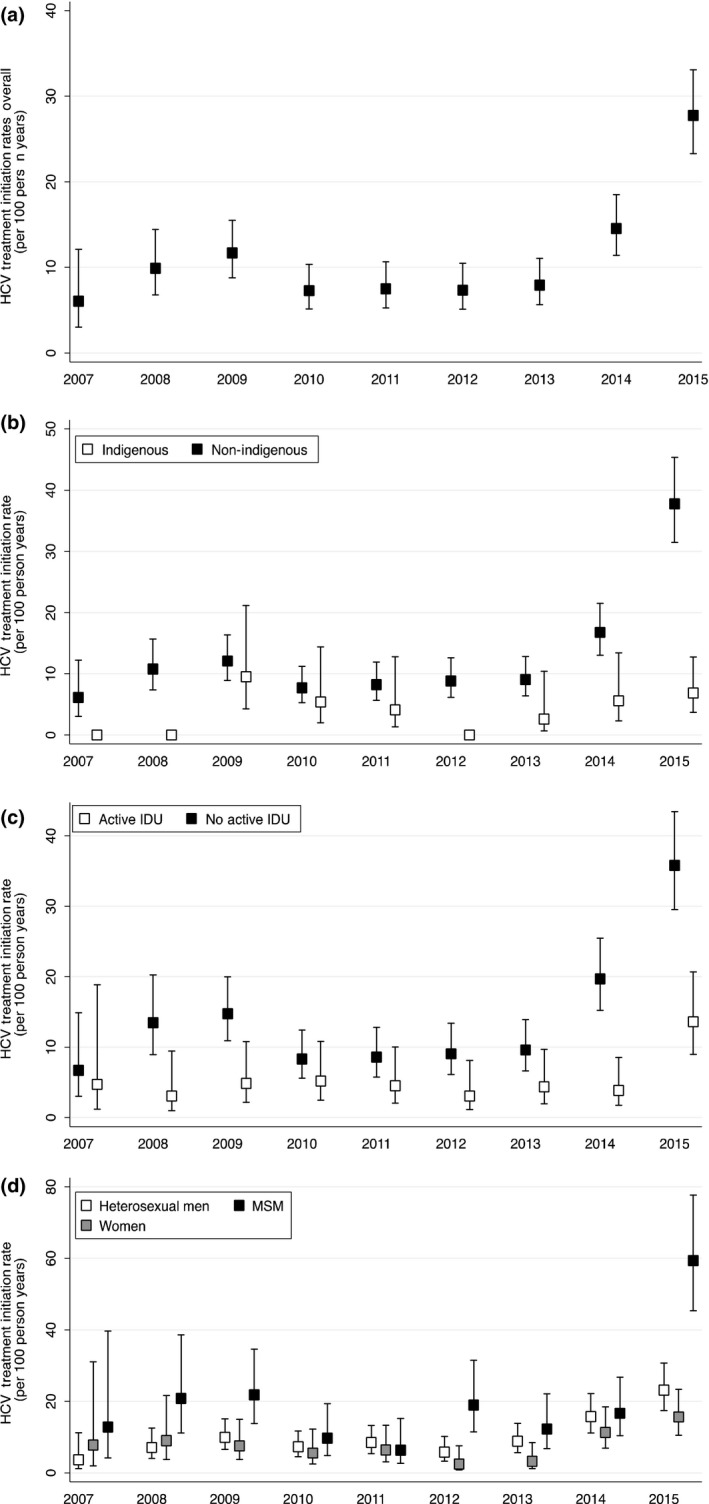
Figure 1.

HCV Treatment Initiation Rates between 2007–2015. A: Overall among the Canadian Co‐Infection Cohort; B: Indigenous (white box) compared to Non‐Indigenous people (black box); C: Active PWID (white box) compared to non‐Active PWID (black box); D: Women (grey box) and MSM (black box) compared to heterosexual men (white box). Rates per 100 person years, whiskers represent 95% confidence intervals. PWID: people who inject drugs; MSM: men who have sex with men; IDU: injection drug use.
