
Figure 3.
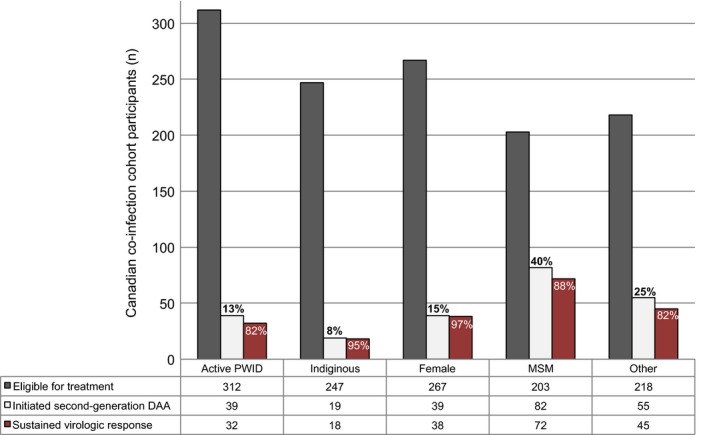
Second‐generation DAA treatment cascade. Bar graph represents overall numbers of patients eligible for treatment, initiate second‐generation DAAs and achieved SVR by key populations. CCC: Canadian Co‐Infection Cohort; PWID: people who inject drugs; MSM: men who have sex with men; SVR: sustained virologic response.