
Figure 2.
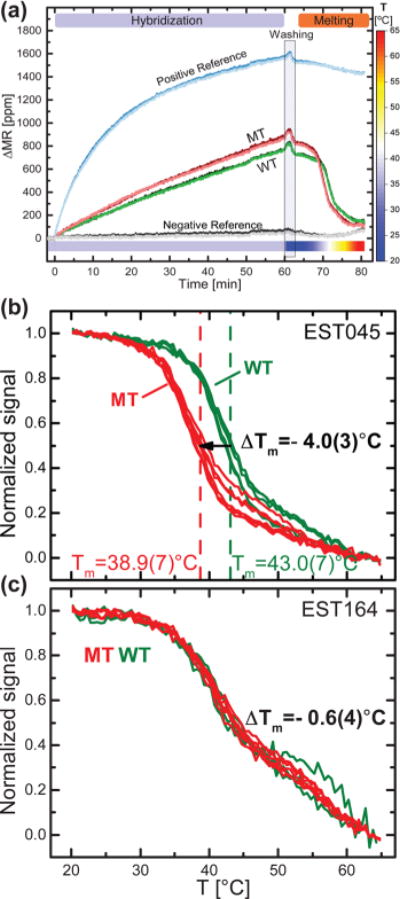
(a) Time series of the signal (ΔMR) from GMR biosensors functionalized with positive and negative references, wild type (WT) and mutant type (MT) probes for the BRAF c.1391 G > A mutation. Each line corresponds to up to three sensors functionalized with the same probe. The measurement was performed with PCR products from EST045 cell line that is WT for the investigated mutation. The sample was injected at t = 2 min. After 60 min hybridization at 37 °C, the chip was washed and the temperature was ramped from 20 to 65 °C while measuring the melting curves. (b) and (c) show melting curves from WT (green) and mutant type MT (red) probes targeting BRAF c.1391 G > A mutation obtained for the indicated cell lines, where the EST045 and EST164 cell lines were wild type and heterozygous mutant, respectively. Signals were normalized by the initial signal at T = 20 °C. The melting temperature Tm is defined as the temperatures at which the normalized curves cross 0.5. ΔTm is the difference in melting temperature between the MT and WT probes. The numbers in parentheses are standard deviations on the last significant digit (n = 4–6). Graphs of the first derivative of the melting curves are available in Supporting Information Figure S3.