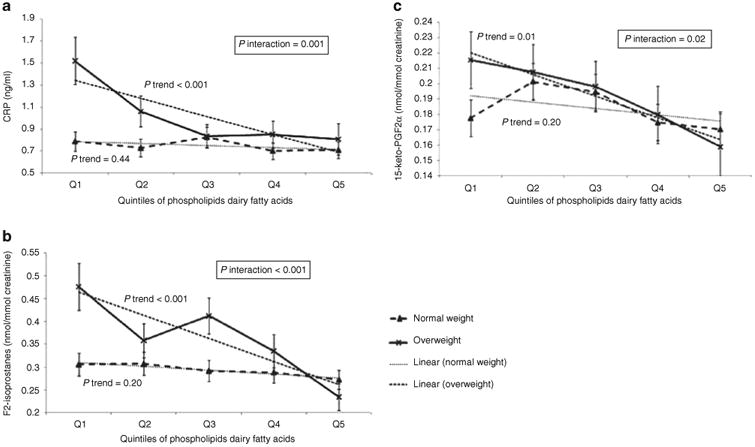
Figure 1.

The interactions between weight status and biomarkers of dairy fats in relation to inflammation and oxidative stress, adjusted for gender, age, ethnicity, tanner score, total calorie intake and physical activity (n = 305). (a) Association of phospholipids dairy fatty acids with C-reactive protein (CRP) among normal weight and overweight adolescents. (b) Association of phospholipids dairy fatty acids with 8-iso-PGF2α among normal weight and overweight adolescents. (c) Association of phospholipids dairy fatty acids with 15-keto-PGF2α among normal weight and overweight adolescents. Geometric mean levels for CRP and F2-isoprostanes.
