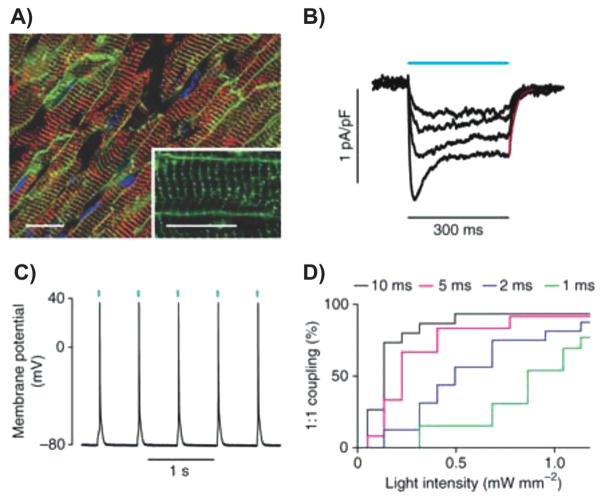
Figure 11.
Engineering stem cells to achieve optogenetic control of heart muscle. Expression and function of ChR2 in ventricular cardiomyocytes from CAG-ChR2 mice. A) Fluorescence image of the native membrane-bound ChR2-EYFP signal (green) overlaid with α-actinin immunostaining (red) in cardiomyocytes of the ventricle and colocalization with the t-tubulus system (inset). Nuclei are shown in blue. Scale bars, 20 μm. B) Inward currents evoked at a holding potential of −40 mV by light stimulation at 0.09, 0.18, 0.45 and 1.75 mW mm−2 (from top to bottom). Monoexponential fit to measure the time constant of decay is shown in red. pA, picoampere; pF, picofarad. C) Repetitive action potential generation by 1-ms light pulses (blue bars) of 0.91 mW mm−2. D) Action potential generation by light pulses (10 ms; light blue line) of different intensities in a representative single cell. Reproduced with permission.[228] Copyright 2010, Nature.

