
Figure 3.
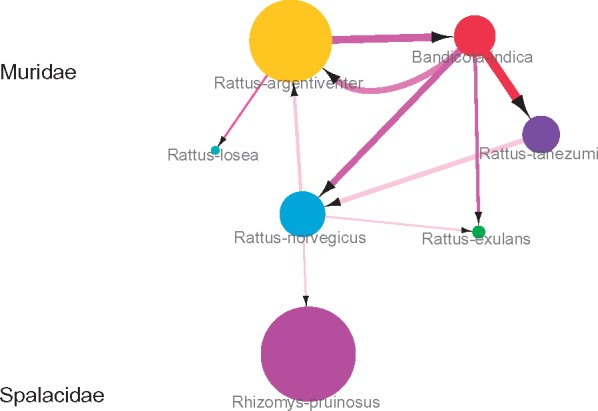
Transmission network of kobuviruses in 7 rodent species. Size of nodes describes the number of kobuviruses from each species. Arrows show the direction of transmission between species; the arrow width indicates per capita transmission rate (exchanges year−1). Transmission rates and BF support are given in Supplementary Table S3.