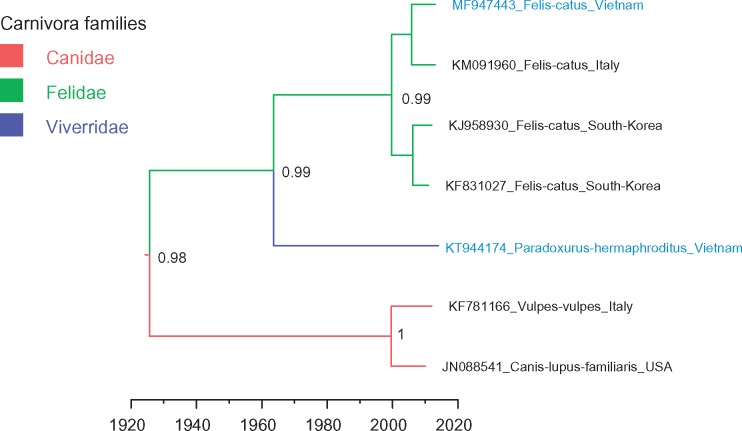
Figure 5.
MCC tree representing the time-scale phylogeny of kobuviruses found in carnivora according to the VP1 gene. Branches are coloured according to their descendent nodes gannotated by the different carnivora families, with the key for colours shown on the left. The accession number with the host species and isolation countries of sequences are showed at the tips. Sequences obtained in this study are highlighted in blue. Bayesian posterior probabilities are given at the nodes of major clades. The scale bars indicate the branch lengths in year.

