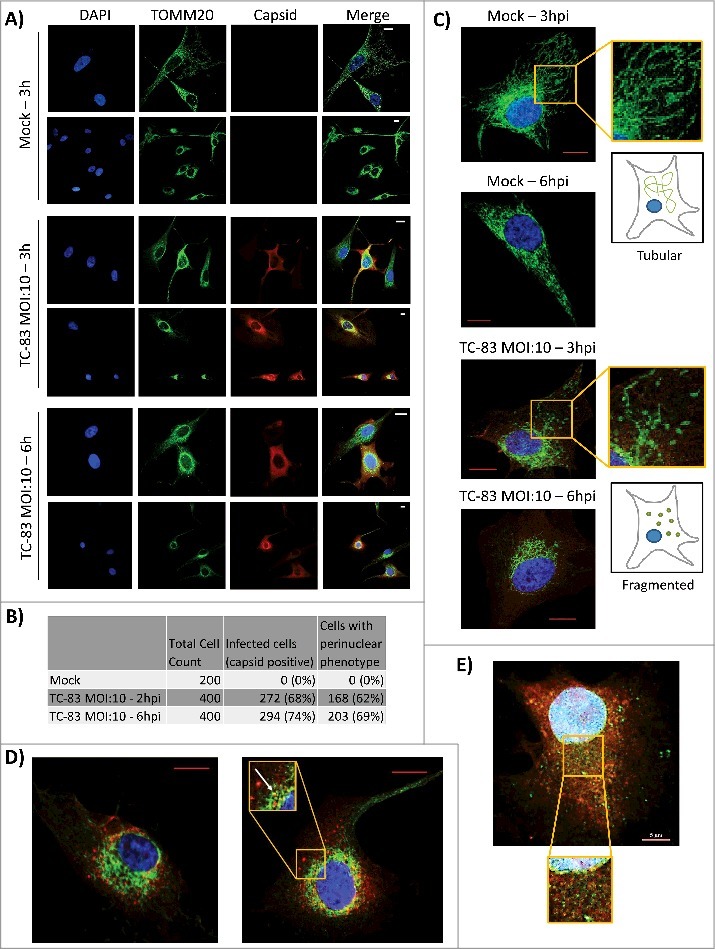
Figure 3.

VEEV capsid localized in the mitochondria of infected cells. (A) Confocal images showing the co-localization of VEEV capsid (red) with mitochondrial marker TOMM20 (green). (B) Cell count summary of perinuclear phenotype observed in panel (A). (C) Magnified images of uninfected U87MGs displaying healthy, tubular mitochondria networks, and infected cells displaying a perinuclear clustering of mitochondria. (D). Confocal images showing perinuclear clustering of TOMM20 (green), and partial co-localization with VEEV capsid (red) (see arrow). E) Confocal images showing no co-localization between ER marker calnexin (green) and VEEV capsid (red). Scale bar indicates 5µm. A, C-E) Nuclei stained with DAPI (blue). (A, C-D) Scale bars indicate 10µm.
