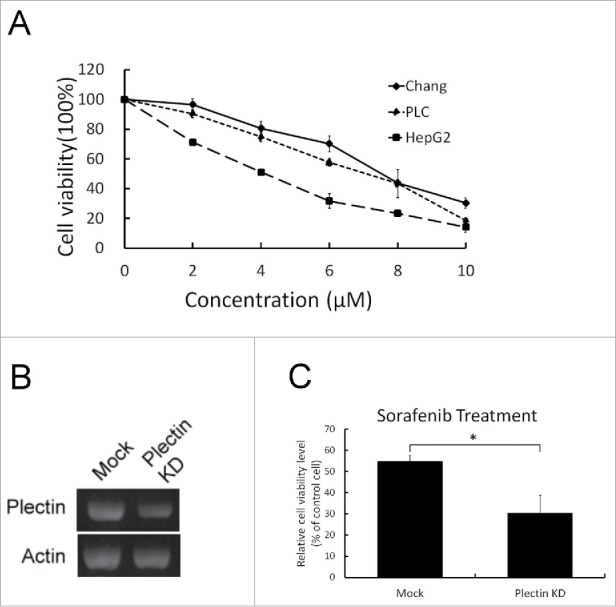
Figure 4.

Sorafenib treatment in liver cells, hepatoma cells, and plectin knockdown-liver cells. (A) Sorafenib (from 0 to 10 μM) was applied in Chang liver cells, PLC/PRF/5 and HepG2 cell lines. Cell viabilities were determined in 72 hours. The data showed that HepG2 cells were more sensitive to sorafenib treatment than Chang liver cells and PLC/PRF/5 cell lines were. (B) Reduction in mRNA expression of Chang liver cells was associated with transient knockdown of plectin. (C) Sorafenib (10 μM) was applied in mock and plectin knockdown-Chang liver cell respectively. Plectin knockdown-cells revealed significantly higher sensitivity to sorafenib treatment (p < 0.05).
