
Figure 2.
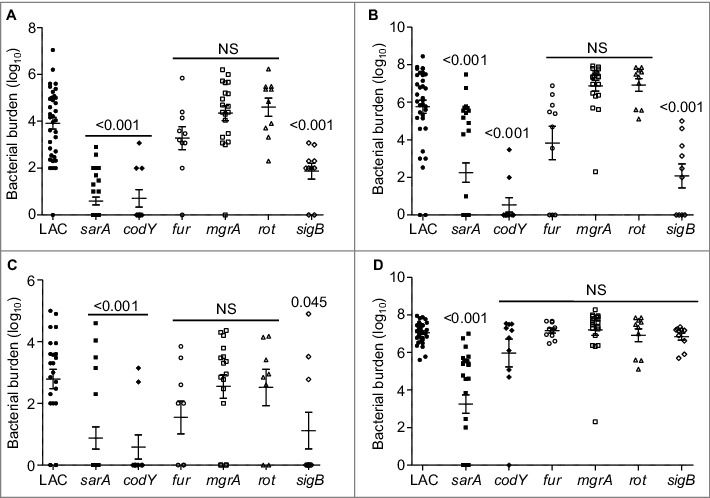
Relative virulence of S. aureus regulatory mutants as assessed by colonization. The number of colony-forming units (cfu) in the (A) spleen, (B) heart, (C) peripheral blood, and (D) kidney are shown by scatter plot. Numbers above each plot indicate p values for each mutant by comparison to the results observed with LAC. NS = not significant. Bars represent the mean ± SEM of log10 transformed values.