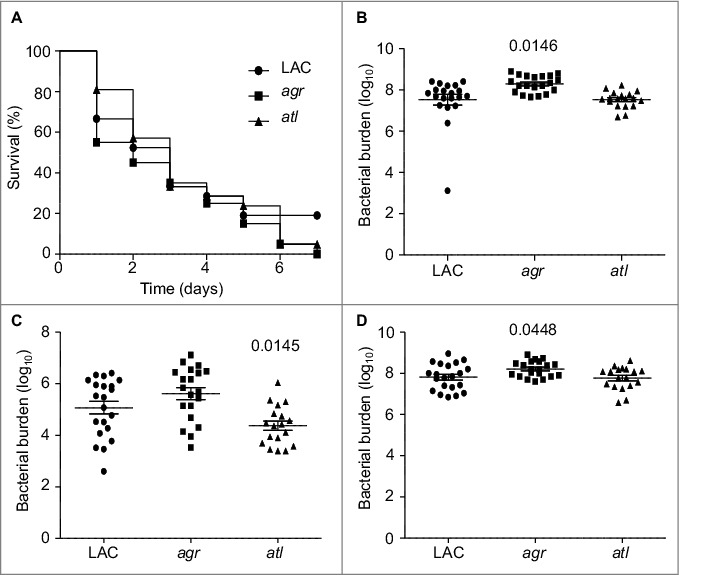
Figure 4.

Relative virulence of S. aureus agr and atl mutants in acute sepsis. (A) Kaplan-Meier survival curves are shown for LAC and the indicated isogenic mutants. Number of cfu observed in homogenates prepared from (B) heart, (C) spleen, and (D) kidney. The number above each scatter plot cluster indicates the p value for each mutant found to significantly different by comparison to LAC. Bars represent the mean ± SEM of log10 transformed values.
