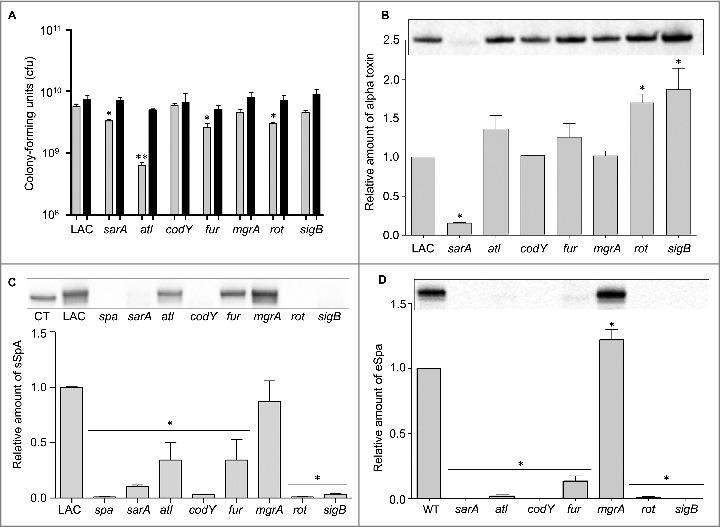
Figure 5.

Analysis of mutant aggregative phenotypes and their respective production of alpha toxin and Spa. (A) Bars indicate the number of cfu observed before (grey) and after sonication (black). Single asterisk indicates statistical significance prior to sonication by comparison to LAC. Double asterisk indicates statistical significance of the atl mutant by comparison to all other strains prior to sonication. No significant differences were observed after sonication. (B) Representative western blot of conditioned medium from LAC and the indicated isogenic mutants using anti-alpha toxin antibody (top). Graph indicates cumulative densitometric values obtained from all biological and experimental replicates (bottom). (C) Representative western blot of surface protein preparations from LAC and the indicated isogenic mutants using anti-Spa antibody (top). CT = purified Spa control. Graph indicates cumulative densitometric values obtained from all biological and experimental replicates (bottom). (D) Representative western blot of conditioned medium from LAC and the indicated isogenic mutants using anti-Spa antibody (top). Graph indicates cumulative densitometric values obtained from all biological and experimental replicates (bottom). Asterisks in each graph indicate statistical significance (p ≤ 0.05) by comparison to values obtained with the LAC parent strain.
