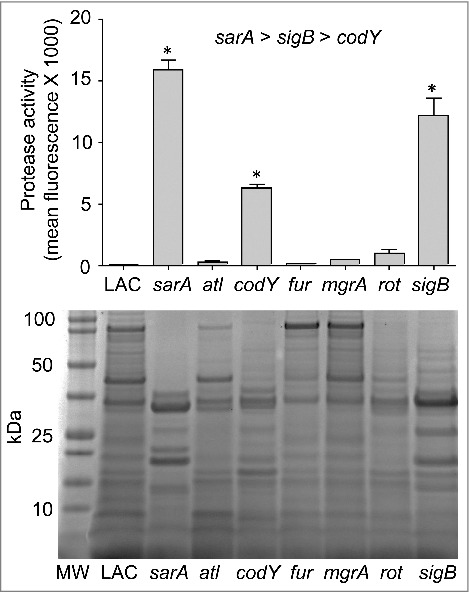
Figure 6.

Protease activity in LAC regulatory mutants. Top: Total protease production in LAC and the indicated regulatory mutants was assessed using a commercially available FITC-casein cleavage hydrolysis assay. Results are reported as mean fluorescence values ± the standard error of the mean. Asterisks indicate statistically significant differences (p ≤ 0.05) between the indicated mutants relative to the results observed with LAC. As indicated above the graph, individual comparisons also confirmed that the amount of total protease activity observed in the sarA mutant was increased to a statistically significant extent by comparison to the results observed with both the sigB and codY mutants and that total protease activity in the sigB mutant was increased to a statistically significant extent by comparison to those observed with the codY mutant. Bottom: Extracellular protein profiles for LAC and each regulatory mutant were assessed by SDS-PAGE. MW = molecular weight markers, with the molecular weight in kilodaltons (kDa) of representative markers shown to the left.
