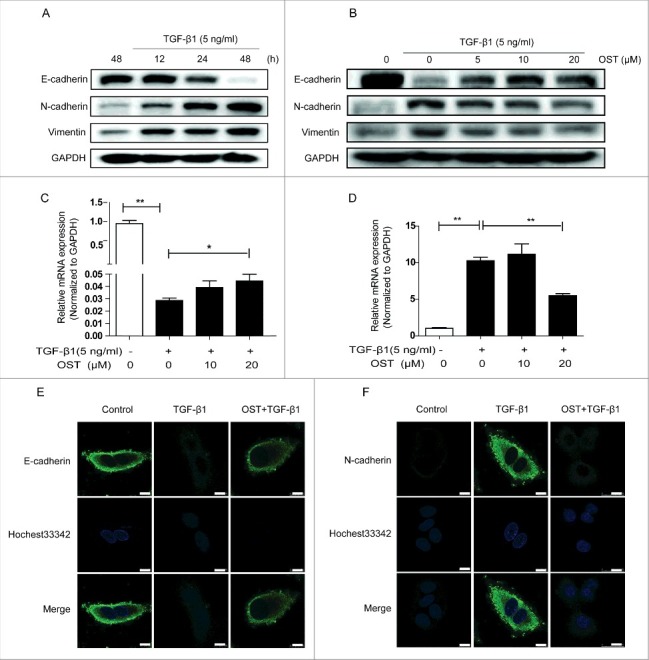
Figure 2.

Effect of OST on the expression of EMT biomarkers. Cells were treated with TGF-β1 and the protein expression was determined by Western blotting (A). Cells were treated with TGF-β1 (5 ng/ml) for 48 h with or without OST co-treatment and the protein and mRNA expression were determined by Western blotting (B) and qRT-PCR (C and D), respectively. Immunofluorescence staining was performed for detecting the expression of E-cadherin (E) and N-cadherin. Scale bar = 10 μm. (F). *p < 0.05 and **p < 0.01. OST, osthole.
