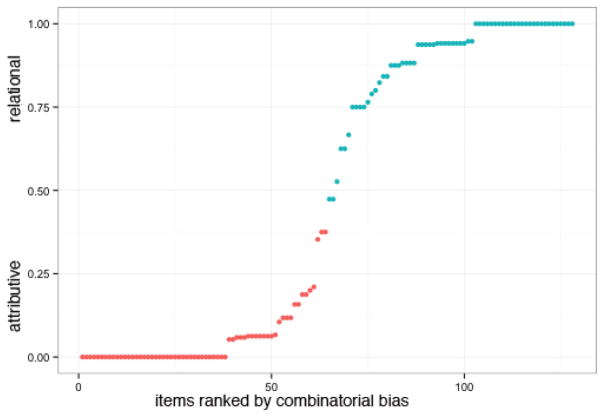
Figure 1.
Plot of relational-attributive combinatorial bias (normed on 35 participants, inclusive of 18 fMRI subjects). Figure 1 shows the distribution of attributive and relational combinatorial bias by item, order-ranked from unanimously attributive (relational bias = 0) interpretations to unanimously relational (relational bias = 1) interpretations. Blue indicates those items marked as relational in Estes (2003) and Wisniewski & Love (1998) studies and red indicates those marked as attributive in those studies. This aggregate combinatorial bias measure was included as a continuous covariate in one model, while the individual subject response (attributive/relational) was treated as a categorical variable in a model of individual BOLD timecourses.

