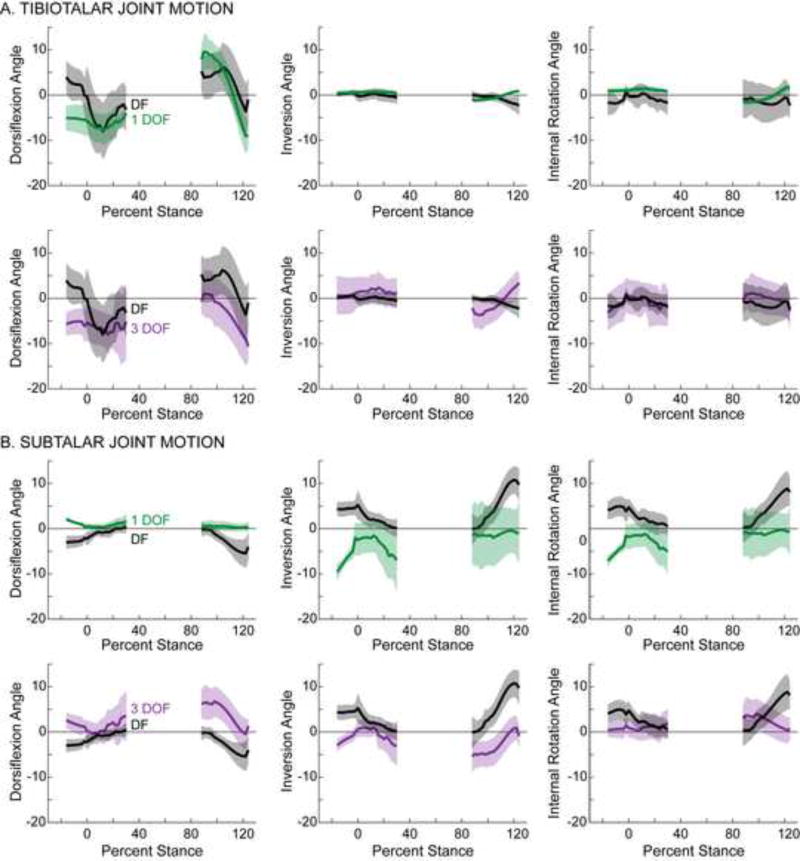
Figure 2.
Motion of (A) tibiotalar and (B) subtalar joints during the heel-strike and toe-off activities. Joint angles calculated using the 1 DOF model (green) and the 3 DOF model (purple) are plotted separately to facilitate comparison with the joint angles calculated using the experimental dual-fluoroscopy (DF) data (black). Solid lines represent average across subjects. Given that the length of trials varied across subjects, averages were calculated for any region for which data existed for at least 5 subjects. Shaded regions represent one standard deviation. All joint angles are plotted versus the percentage of the stance phase of gait, where 0% represents heel-strike of the imaged foot and 100% represents toe-off of the imaged foot. Dorsiflexion, inversion, and internal rotation are defined as positive.

