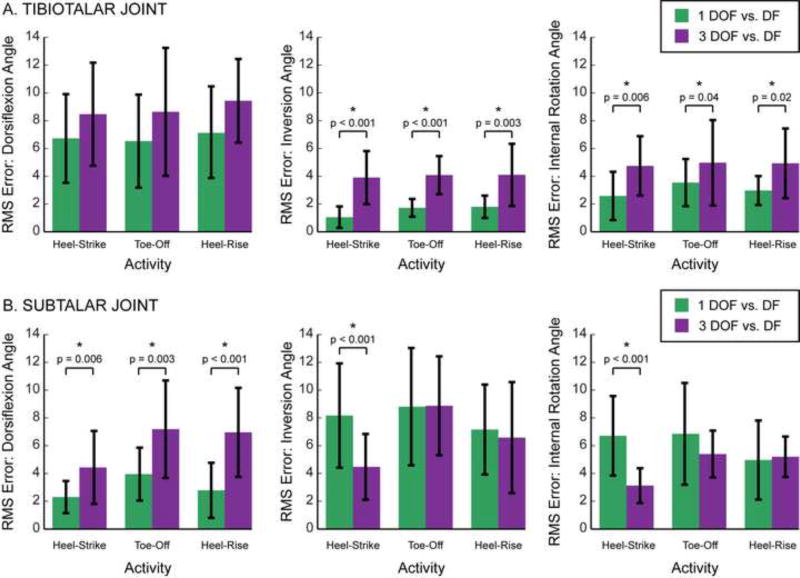
Figure 3.
Root mean square (RMS) errors of the (A) tibiotalar and (B) subtalar joints during each activity. For each model, the RMS errors were calculated between joint angles predicted by the models versus measured experimentally using dual-fluoroscopy. The RMS errors are displayed separately for the 1 DOF (green) and 3 DOF (purple) models. Bars represent average across subjects. Error bars represent one standard deviation, thereby illustrating across subject variability. Asterisks (*) and displayed p-values indicate a significant difference between the RMS errors for the 1 and 3 DOF models.

