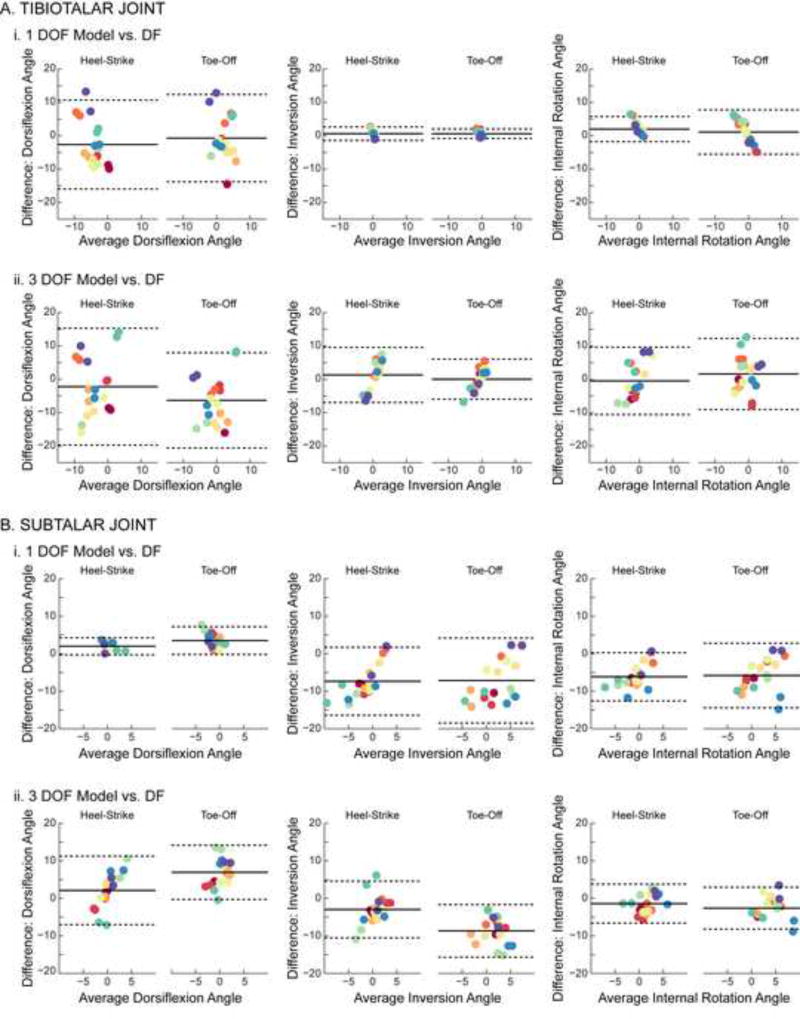
Figure 4.
Bland-Altman plots of (A) tibiotalar and (B) subtalar joint motion during the heelstrike and toe-off activities. Differences between motions predicted by the models versus measured experimentally using dual-fluoroscopy (DF) are displayed separately for the (i) 1 DOF and (ii) 3 DOF models. Within each trial (unique points) and subject (unique colors), differences were calculated across all collected time points and then averaged. All calculated differences are model minus experimental, thus positive values represent an overestimation by the model. Solid lines represent mean difference (i.e., bias). Dotted lines represent 95% limits of agreement. Dorsiflexion, inversion, and internal rotation are defined as positive.

