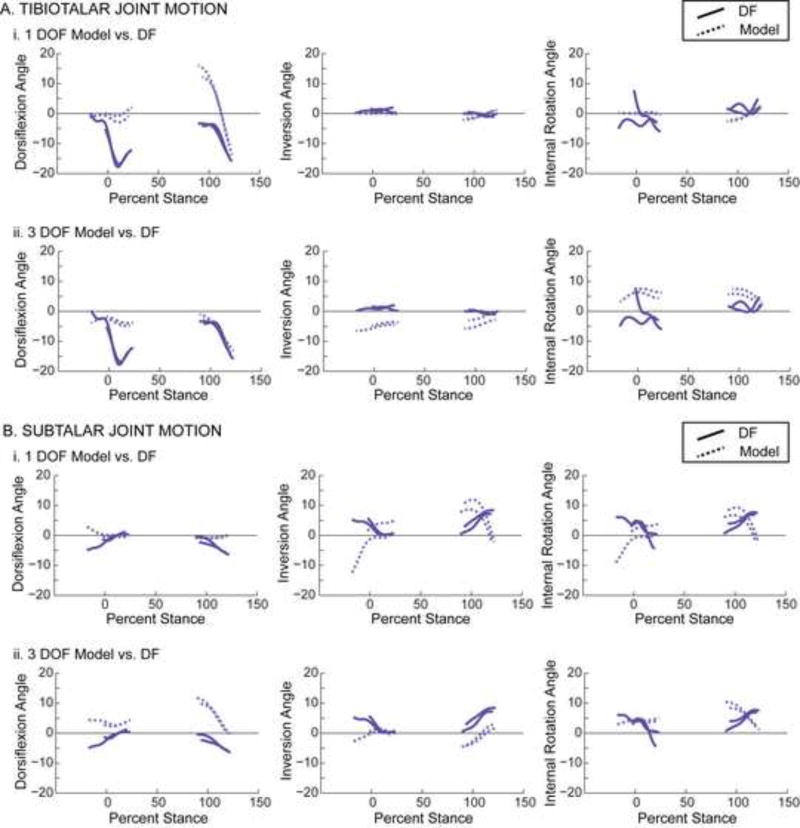
Figure 5.
Motion of (A) tibiotalar and (B) subtalar joints during four separate walking trials (two heel-strike and two toe-off) from a single subject. The displayed subject demonstrated some of the largest tibiotalar joint angle errors, as evidenced in the Bland-Altman analysis (plotted color chosen to be consistent with Bland-Altman plots in Fig. 4). Joint angles calculated using the models (dotted lines) are plotted separately for the (i) 1 DOF and (ii) 3 DOF models to facilitate comparison with the joint angles calculated using the experimental dual-fluoroscopy (DF) data (solid lines). All joint angles are plotted versus the percentage of the stance phase of gait, where 0% represents heel-strike of the imaged foot and 100% represents toe-off of the imaged foot. Dorsiflexion, inversion, and internal rotation are defined as positive.

