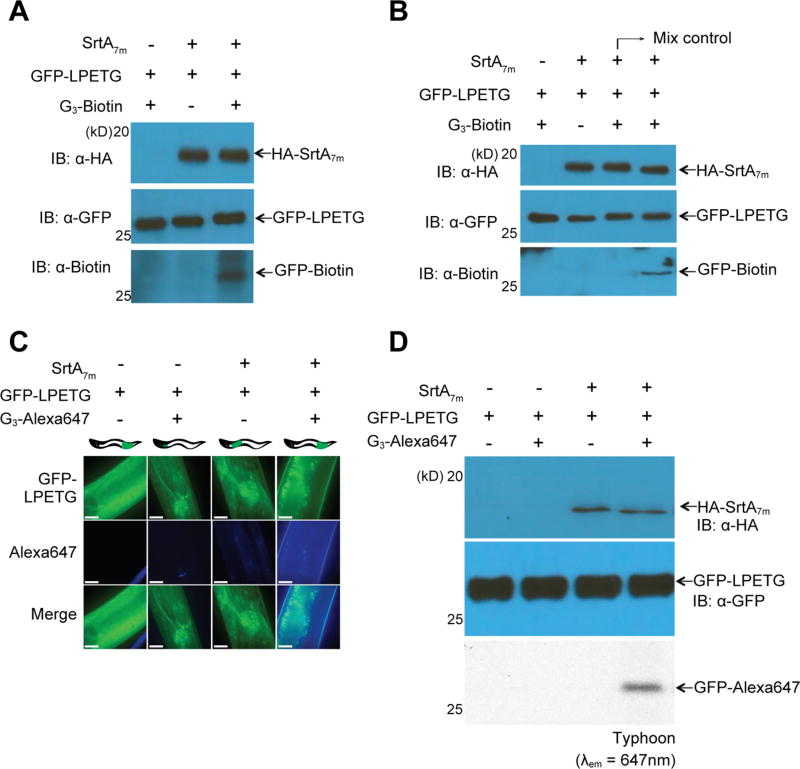
Figure 3.
Sortase-mediated protein labeling. (A) A lysate of transgenic animals expressing GFP-LPETG and SrtA7m following heat-shock was supplemented with G3-biotin (1 mM) and 100 µL of sortagging reaction buffer (50 mM Tris, pH 7.5, 150 mM NaCl). (B) In vivo sortagging in C. elegans: animals expressing SrtA7m upon heat-shocking and GFP-LPETG substrate were fed with G3-biotin. The mixing control consists of a 1:1 mixture of lysates from animals either expressing GFP-LPETG substrate or SrtA7m enzyme, previously fed with G3-biotin (1 mM) and lysed in buffer supplemented with 1% SDS and 2% NP40. (C,D) Phsp-16.2::srtA7m; Peft-3::GFP-LPETG strain was fed with G3-Alexa 647 for 5 h at RT. Worms were transferred to a fresh plate for a further 24 h and (C) collected for imaging by confocal fluorescence microscopy or (D) lysed and resolved by SDS-polyacrylamide gel electrophoresis (PAGE). Samples were visualized by immnoblotting (upper panel) or Typhoon in gel scanning (lower panel) at λem = 647 nm. The scale bar represents 10 µm. GFP-LPETG and SrtA7m signal distributions shown in (C) are representative for the entire animal. Pearson colocalization coefficient for images shown in panel 4 is 0.754. All images were acquired with the same laser and exposure settings.

