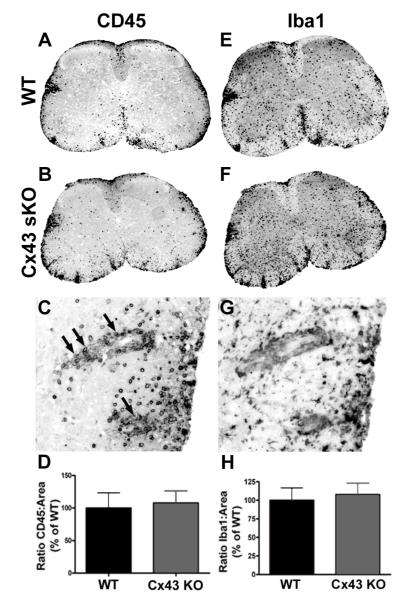
Figure 2. Leukocyte and microglial immunostaining in spinal cord sections from WT and Cx43 sKO EAE mice.
Sections were stained for CD45 (panels A C) or Iba1 (panel E-G) and the extent of immunoreactivity was quantified using ImageJ (D, H). Panels A-B, low power images from WT (A) and Cx43 sKO (B) mice exhibit CD45+ leukocytes in inflammatory lesions. The submeningeal location in white matter is characteristic of lesion distribution in EAE. C, A higher power view of the lateral column from the Cx43 sKO mouse shows perivascular cuffing (arrows) and parenchymal infiltration in an EAE lesion. D, quantification of immunostaining showed no difference between WT (n=9) and Cx43 sKO (n=7) EAE mice. E-F, serial sections stained for the microglial calcium-binding protein Iba1. Low power view (4x) shows strong immunostaining in submeningeal lesions and gray matter. G, A higher power (20x) view shows that immunoreactivity is associated with small process bearing cells consistent with a microglial phenotype. Serial section from panel C. H, quantification of immunostaining showed no difference in EAE between WT and Cx43 sKO mice.

