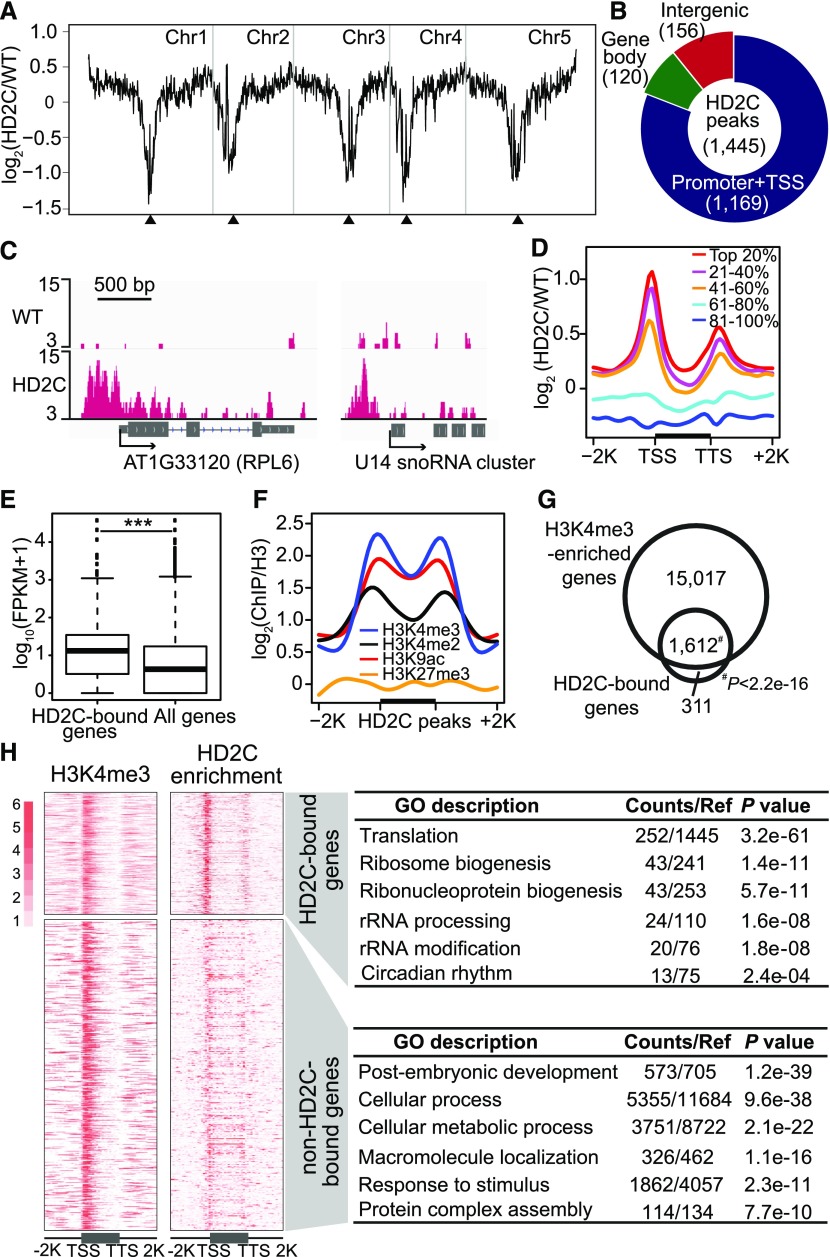
Figure 1.
HD2C Binds Promoters of Active Genes Involved in Ribosome Biogenesis.
(A) Chromosomal view of HD2C binding. The y axis represents the log2 value of HD2C ChIP-seq reads relative to those of untagged wild-type control; Chr1 to Chr5 represent five chromosomes; black triangles indicate positions of centromeres.
(B) Genomic distribution of HD2C binding peaks.
(C) Representative snapshots of HD2C binding to gene promoters.
(D) Metaplots of HD2C ChIP-seq reads over genes. All Arabidopsis genes were divided evenly into five groups based on their expression level in the wild type. Top 20% indicates the 20% genes with highest expression level, and 81 to 100% indicates the 20% genes with lowest expression level. The y axis represents the log2 value of HD2C-FLAG ChIP-seq reads relative to those of untagged wild-type control.
(E) Box plot of expression levels of genes bound by HD2C and all genes in the genome.
(F) Metaplots of histone modification levels over HD2C binding peaks. Black bar in the x axis represents the HD2C binding peaks; y axis represents the levels of histone modifications normalized with H3; −2K and +2K represent 2 kb upstream and downstream of HD2C binding peaks, respectively.
(G) Venn diagram of overlap between HD2C-bound genes and H3K4me3-enriched genes.
(H) Heat maps of HD2C-bound genes and H3K4me3-enriched genes and their functional enrichment. TSS, transcription start site; TTS, transcription terminal site. −2K and +2K represent 2 kb upstream of TSS and 2 kb downstream of transcription terminal site, respectively.

