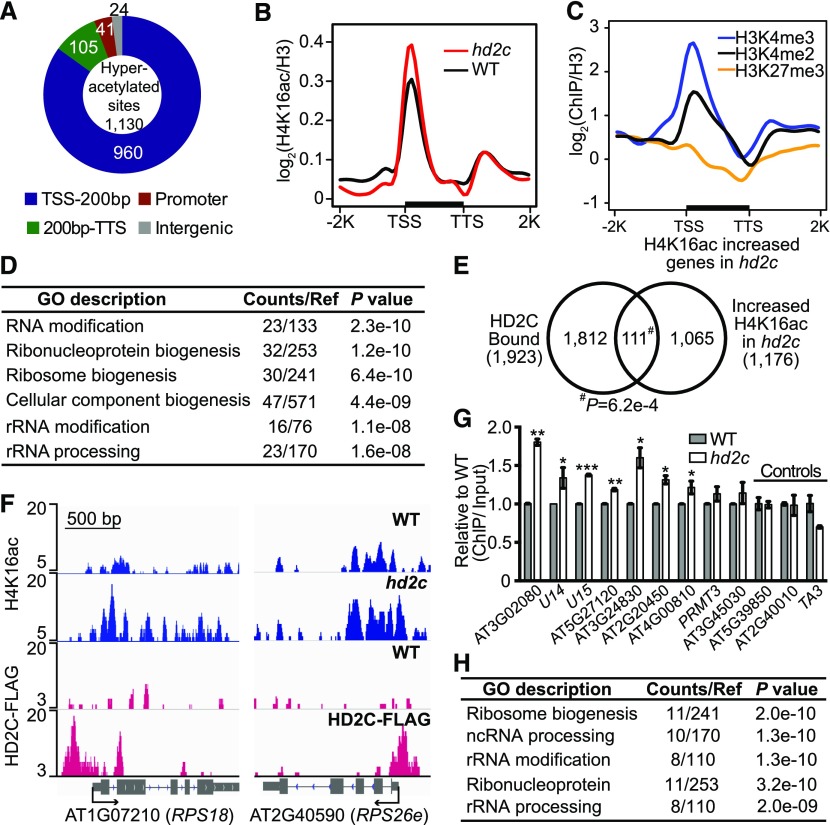
Figure 3.
Depletion of HD2C Results in H4K16ac Hyperacetylation at Ribosomal Genes in Arabidopsis.
(A) Genomic distribution of H4K16 hyperacetylated peaks in hd2c. TSS-200bp represents transcription start site and its 200 bp downstream region; 200bp-TTS represents the rest gene region and transcription terminal site.
(B) Metaplots of H4K16ac over genes in the wild type and hd2c. TSS, transcription start site; TTS, transcription terminal site. −2K and +2K represent 2 kb upstream of TSS and 2 kb downstream of TTS, respectively. y axis represents the log2 value of H4K16ac ChIP-seq reads normalized with H3 ChIP-seq reads.
(C) Metaplots of histone marks on H4K16ac increased genes in hd2c. y axis represents log2 values ChIP-seq reads of histone marks normalized with those of H3.
(D) GO analysis of genes with increased H4K16ac in hd2c.
(E) Venn diagram of HD2C-bound genes and H4K16ac increased genes in hd2c. P value was calculated with Fisher’s exact test.
(F) Representative snapshots of HD2C occupancy and H4K16ac levels over genes selected from the overlapped group in (E).
(G) Validation of H4K16 hyperacetylation at genes selected from the overlapped group in (E). ChIP-qPCR value was normalized with input and then the wild type was set as 1. Data are represented as mean ± sd with two biological replicates. Two loci (AT5G39850 and AT2G40010) that did not show increased H4K16ac in hd2c and a transposon TA3 were used as negative control. Student’s t test, *P < 0.05, **P < 0.01, and ***P < 0.001.
(H) GO analysis of genes showed both HD2C binding and increased H4K16ac in hd2c.

