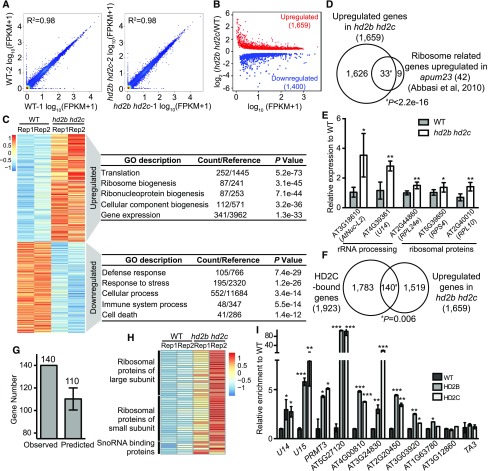
Figure 6.
HD2C and HD2B Directly Repress Expression of Ribosome Biogenesis-Related Genes.
(A) Scatterplots for two RNA-seq biological replicates of the wild type and hd2b hd2c. Expression level was calculated by log10 (FPKM+1).
(B) Scatterplot of differentially expressed genes in hd2b hd2c double mutant. Red dots and blue dots represent upregulated and downregulated genes, respectively. x axis represents the expression level of genes in the wild type by calculating log10 value of FPKM+1. y axis represents the log2 value of gene expression level in hd2b hd2c relative to the wild type. FPKM, fragments per kilobase of transcript per million mapped reads.
(C) Heat maps of differentially expressed genes in two biological replicates of the wild type and hd2b hd2c and their functional enrichment. Color bar indicates the Z-score. Rep1 and Rep2 represent two replicates.
(D) Venn diagram of ribosome biogenesis genes upregulated in apum23 and hd2b hd2c.
(E) RT-qPCR validation of upregulation of overlapped genes in (D). y axis represents the relative expression level to the wild type. Data are represented as mean ± sd from two biological replicates. Student’s t test, *P < 0.05 and **P < 0.01.
(F) Venn diagram of HD2C-bound genes and upregulated genes in hd2b hd2c. P value was calculated with Fisher’s exact test.
(G) Relative enrichments of the observed number of overlapped genes between HD2C binding and upregulation in hd2b hd2c compared with the average overlapped genes by 10,000 genome-shuffling experiments.
(H) Heat maps of expression of ribosome biogenesis genes identified from the 140 genes in (F) in the wild type and hd2b hd2c. Color bar indicates the Z-score.
(I) ChIP-qPCR validation of HD2B and HD2C association with ribosome biogenesis genes selected from overlapped genes in (F). Data are represented as mean ± sd from two biological replicates. Student’s t test, *P < 0.05, **P <0 .01, and ***P < 0.001. Transposable element TA3 served as a negative control.

