Figure 9.
HD2C and HD2B Repress RNA Methylation.
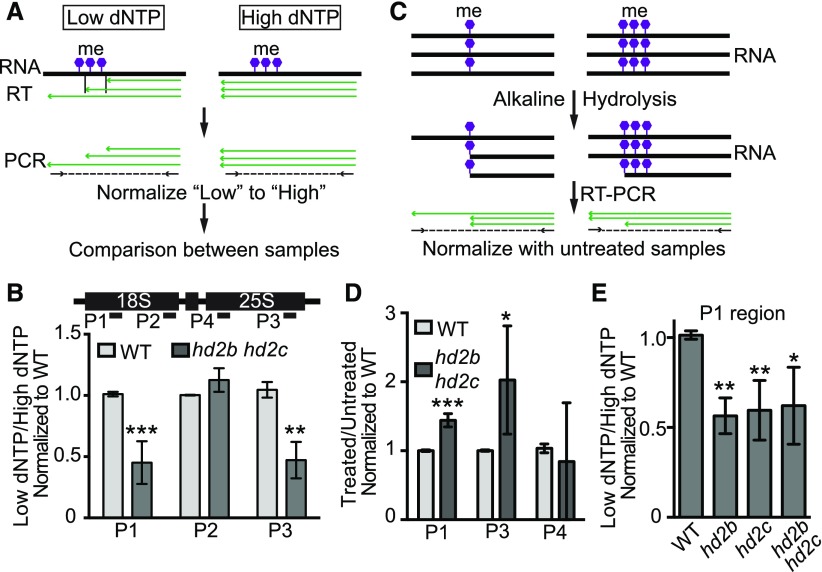
(A) Schema diagram of RNA methylation assay using low dNTP method.
(B) RT-qPCR amplification with 18S and 25S rRNA specific primers in the wild type and hd2b hd2c double mutant using method presented in (A). Lower value indicates higher methylation level.
(C) Schema diagram of RNA methylation assay using alkaline hydrolysis method.
(D) RT-qPCR amplification with 18S and 25S rRNA specific primers in the wild type and hd2b hd2c double mutant using method presented in (C). Higher value indicates higher methylation level. Primer positions were shown in (B).
(E) RT-qPCR amplification with 18S rRNA specific primer in the wild type, hd2b and hd2c single mutants, and hd2b hd2c double mutant using method presented in (A). Lower value indicates higher methylation level. Primer position was shown in (B).
All data are represented as mean ± sd with at least four biological replicates. Student’s t test, *P < 0.05, **P < 0.01, and ***P < 0.001.

