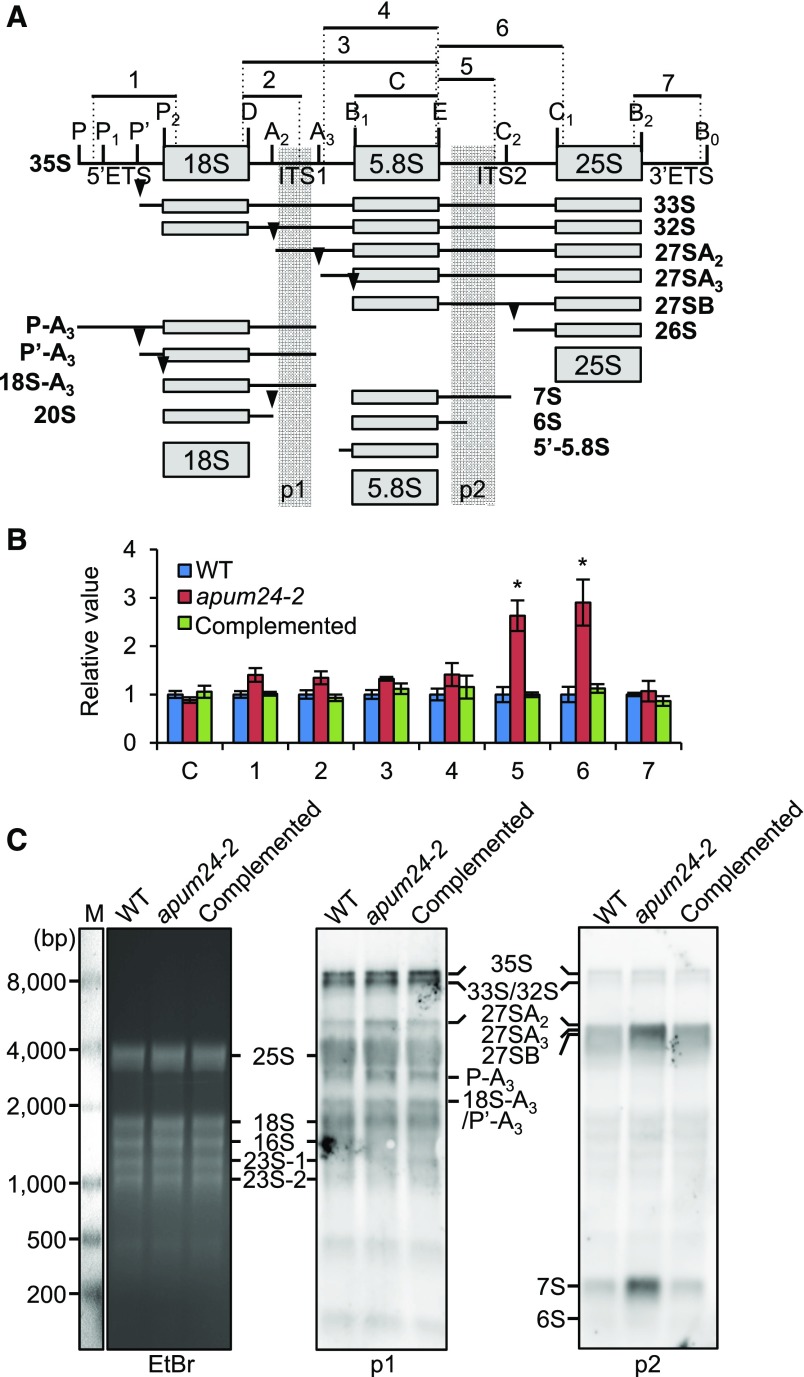
Figure 5.
Pre-rRNA Processing in the apum24-2 Mutant.
(A) Diagram illustrating the major pathways of 35S pre-rRNA processing and 35S pre-rRNA processing intermediates in plants (Weis et al., 2015a, 2015b). Vertical lines and arrowheads indicate the sites of endo- or exonuclease processing. ETS and ITS are the external transcribed spacer and the internal transcribed spacer, respectively. Regions 1 to 7 indicate pre-rRNA fragments that were amplified by PCR with specific primer sets to quantify the respective pre-rRNAs; 5.8S rRNA (region C) was also amplified to compare the total amounts of total rRNA in each sample in (B). Regions p1 and p2 indicate the positions of probes for RNA gel blot detection in (C).
(B) Relative levels of processing intermediates in the apum24-2 mutant and the complemented apum24-2 line grown in the presence of 150 mM glucose. Regions C and 1 to 7 are indicated in (A). The values are expressed relative to the levels in wild-type seedlings, and UBQ10 was used as an internal control to normalize the values. Error bars represent sd (n = 3). Asterisks indicate statistically significant differences between the mutants and the wild type by Student’s t test (P < 0.05).
(C) RNA gel blot detection of pre-rRNA intermediates with probe p1 or p2 whose positions are indicated in (A). The ethidium bromide (EtBr)-stained gel image is shown as a loading control. Detected pre-rRNA intermediates are indicated. Abundant rRNAs (25S, 18S, 16S, and 23S rRNAs) were nonspecifically detected. M, RNA marker.

