Figure 2.
Epistatic Networks Controlling GLS Traits.
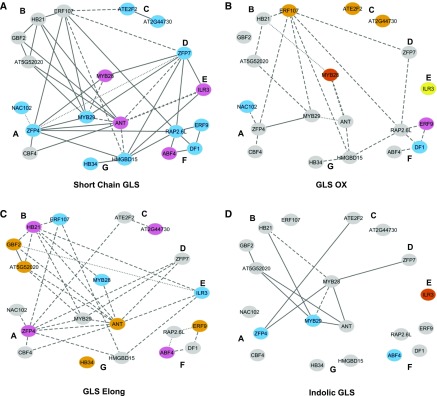
The genetic network from Figure 1 is used to represent the significant epistatic interactions for the four major GLS traits. Only connections that show significant epistasis are maintained, while nonsignificant connections are dropped from the network. A solid line shows that only the TF x TF interaction term was significant in the ANOVA model. A dashed line shows epistatic interactions where there was a significant tissue x TF x TF interaction. A dotted line shows epistatic interactions where there was a significant environment x TF x TF interaction. A line of arrows shows that the interaction was conditional on both tissue and environment. The color of the node indicates which main effect terms are significant for the individual TFs: Sky blue indicates only a TF main effect, orange indicates only a tissue x TF interaction, purple indicates both TF and tissue x TF, yellow indicates both TF and treatment x TF, and red indicates that all three terms are significant. Gray indicates that no terms for the individual TF were significant.
(A) Epistatic network for SC GLS.
(B) Epistatic network for GLS OX.
(C) Epistatic network for GLS Elong.
(D) Epistatic network for indolic GLS.

