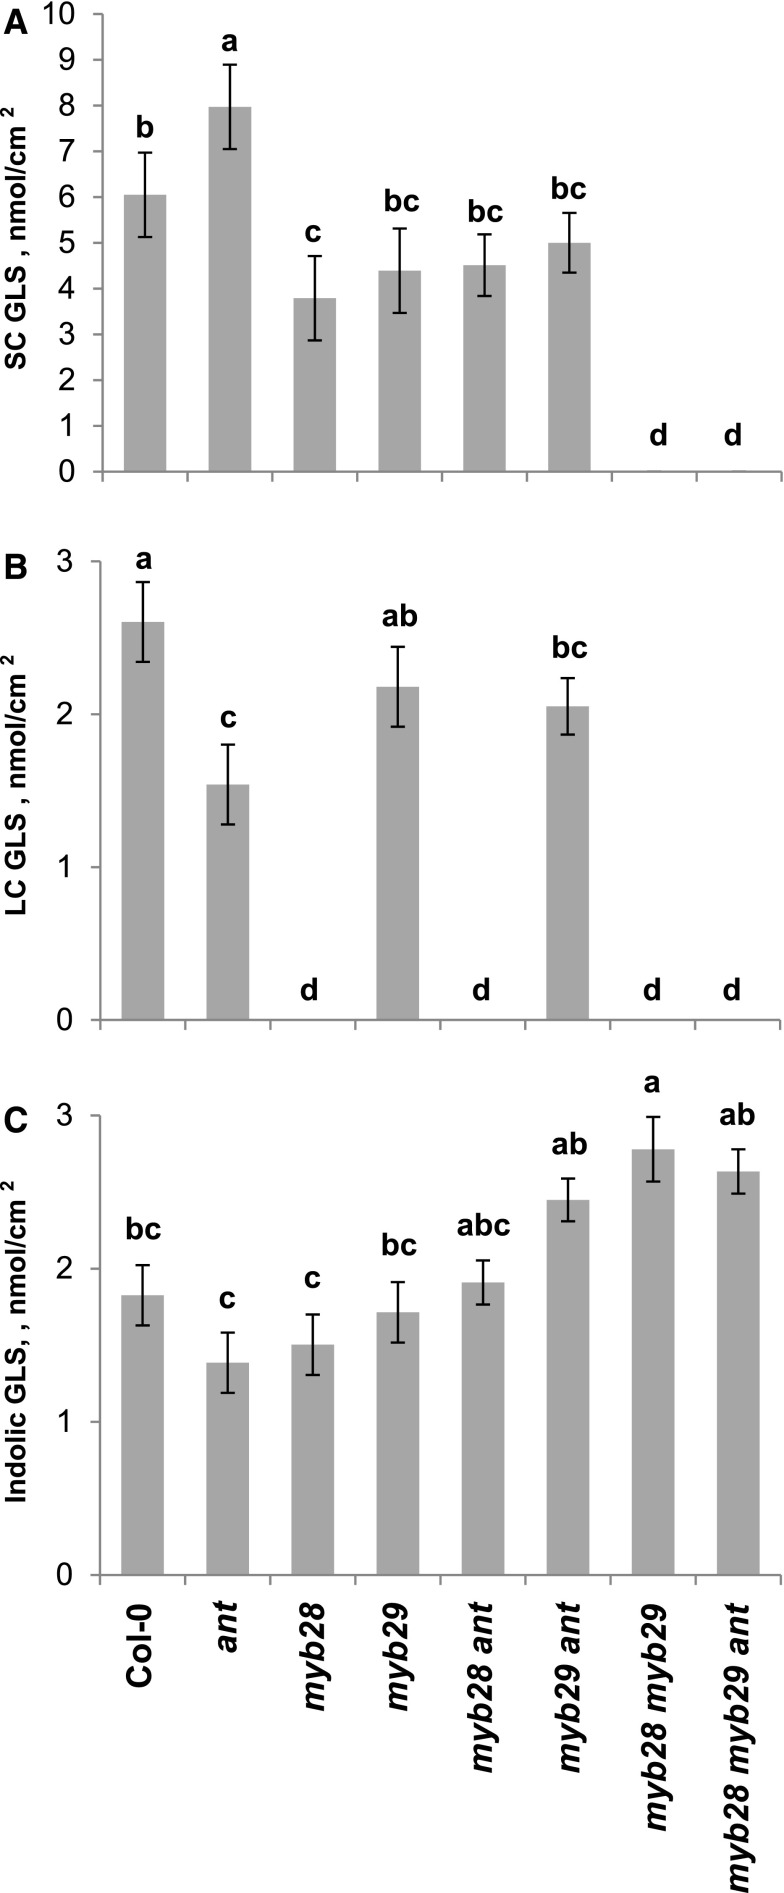
Figure 7.
Leaf GLS Accumulation in All myb28/myb29/ant Combinatorial Genotypes.
Leaf GLS levels in the corresponding genotypes, as measured in the clean CEF chamber. Different letters indicate genotypes with significantly different SC GLS levels (P < 0.05 using post-hoc Tukey’s test after ANOVA). se is shown with 16 samples across two experiments for each genotype.
(A) SC GLS.
(B) LC GLS.
(C) Indolic GLS.

