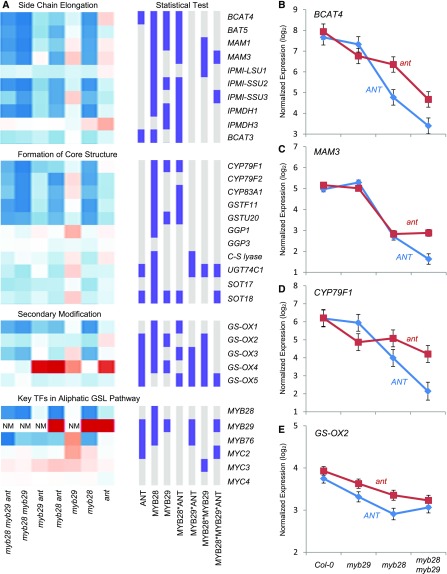
Figure 8.
Transcript Levels for Aliphatic Glucosinolate Biosynthesis Genes in All myb28 myb29 ant Combinatorial Genotypes.
se for each data point is shown from three independent biological samples.
(A) The heat map displays the fold change in transcript levels in the mutants compared with the Col-0 control, with red showing increased accumulation and blue showing decreased accumulation. The columns on the right display the statistical significance (purple, significant P < 0.05; gray, not significant) for each term in the ANOVA model, as listed at the bottom. The expression of MYB29 in the myb29 background lines is shown as NM (not measurable) due to the T-DNA insertion.
(B) Transcript levels of BCAT4. Lines show the values in the ANT (red) and ant (blue) genotypes across the four different myb28 myb29 backgrounds.
(C) Transcript levels of MAM3. Lines show the values in the ANT (red) and ant (blue) genotypes across the four different myb28 myb29 backgrounds.
(D) Transcript levels of CYP79F1. Lines show the values in the ANT (red) and ant (blue) genotypes across the four different myb28 myb29 backgrounds.
(E) Transcript levels of GS-OX2. Lines show the values in the ANT (red) and ant (blue) genotypes across the four different myb28 myb29 backgrounds.

