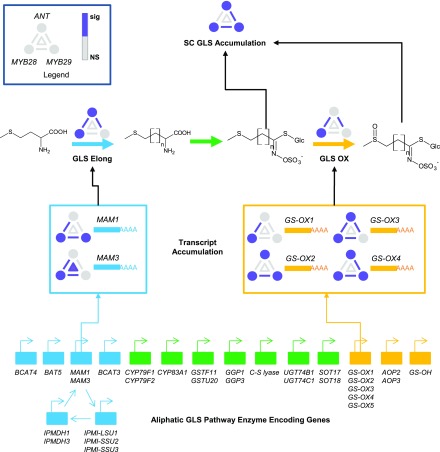
Figure 9.
Shifting Epistatic Interactions of ANT, MYB28, and MYB29 across the Molecular Aliphatic GLS Accumulation Processes.
The bottom of the figure shows the genes involved in the synthesis of aliphatic GLS within Arabidopsis. The different molecular phenotypes measured within this study that pertain to the SC GLS, GLS Elong, and GLS OX processes are shown, from the key transcripts involved in each process to the estimated enzyme activity to the final accumulation of SC GLS. A summary of the statistical effects of the ANT, MYB28, and MYB29 main effects (dots), pairwise interactions (lines between dots), and three-way interaction (triangle) are shown as per the legend. Purple indicates that the specific term was significant for the represented phenotype, and gray indicates nonsignificance. The different processes in aliphatic GLS biosynthesis are shown as follows: blue for elongation-related steps, green for core structure synthesis, and yellow for side chain modification.

