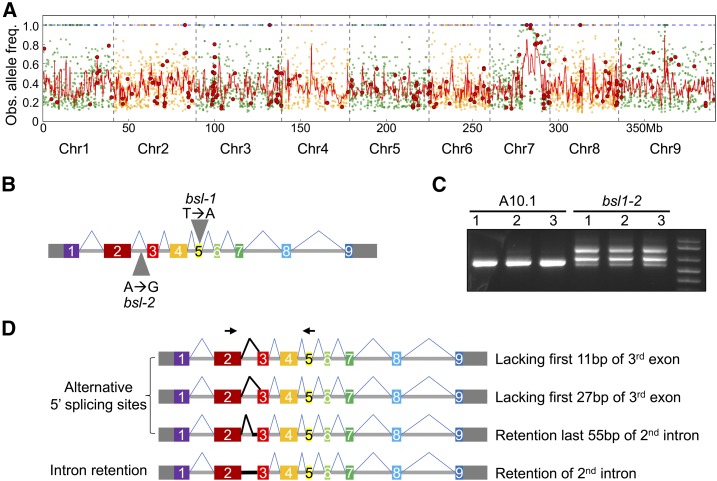
Figure 3.
Mapping of the bsl1 Locus and Analysis of Alternative Transcript Isoforms Produced by the bsl1-2 Allele.
(A) Bulked segregant analysis was performed for the bsl1-1 mutant. Genomic position is plotted on the x axis and observed mutant allele frequency on the y axis. Green and orange dots represent all SNPs of the bsl1-1 mutant genomic pool compared with the A10.1 reference genome and red dots represent nonsynonymous SNPs. The red line is a smoothed curve over a 10-SNP window.
(B) Exon-intron structure of the Bsl1 gene consists of nine exons (solid rectangles) and eight introns (horizontal line). The 5′ and 3′ untranslated regions are shown as gray rectangles. Gray triangles indicate the locations of SNPs responsible for bsl1-1 and bsl1-2 phenotypes.
(C) Gel image of RT-PCR results showing multiple transcript isoforms of Bsl1 in bsl1-2 inflorescence primordia at 15 DAS compared with A10.1.
(D) Diagrammatic image of four transcript isoforms that were detected as alternative splice variants resulting from a SNP in the 2nd intron of bsl1-2. Black arrows indicate the forward and reverse primer sites used for the RT-PCR in (C).

