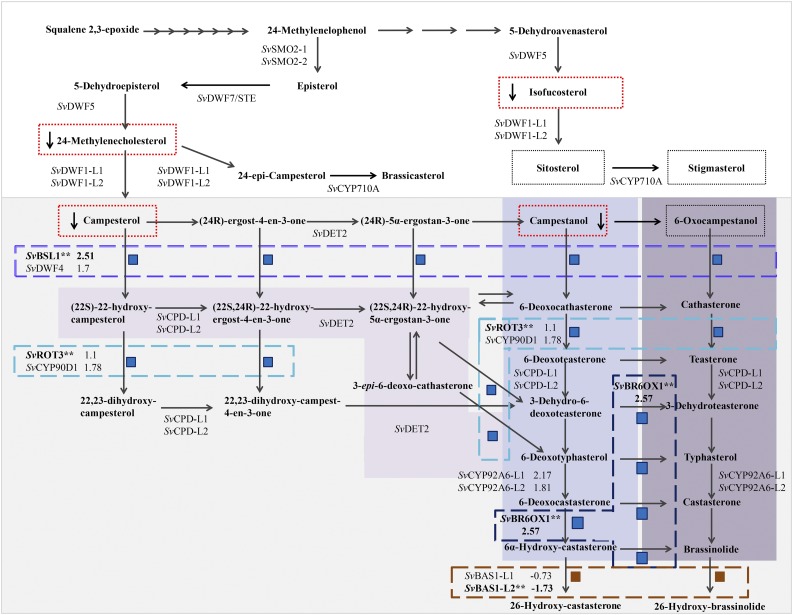
Figure 6.
Proposed Phytosterol and BR Biosynthetic Pathway for S. viridis Shows Where Genes Encoding Enzymes in the Pathway Were Differentially Expressed in bsl1-1 Mutant Inflorescences and Where Changes in Metabolites Were Observed.
BR biosynthesis is highlighted in gray. Subpathways highlighted in purple (from light to dark/left to right) represent the parallel early and late C-6 oxidation pathways and the early C-22 oxidation pathway for BR biosynthesis, respectively. Intermediates that were quantified in wild-type and bsl1-1 mutants are boxed by a dotted line. Those that were significantly decreased in the mutant are boxed in red. Steps catalyzed by enzymes encoded by genes that were differentially expressed in the RNA-seq analyses are boxed by dashed lines (purple = Bsl1; turquoise = SvROT3; dark blue = SvBR6OX1; burnt orange = SvBAS1-L2). Each of these DE genes (asterisks) is associated with two or more metabolic steps, each noted by a blue (upregulated in the mutant) or dark-red (downregulated in the mutant) square. Log2 fold change is indicated for DE genes, their close paralogs, and for SvCYP92A6-L1/2.

