Figure 3.
MLK1 and MLK2 Interact with RGA.
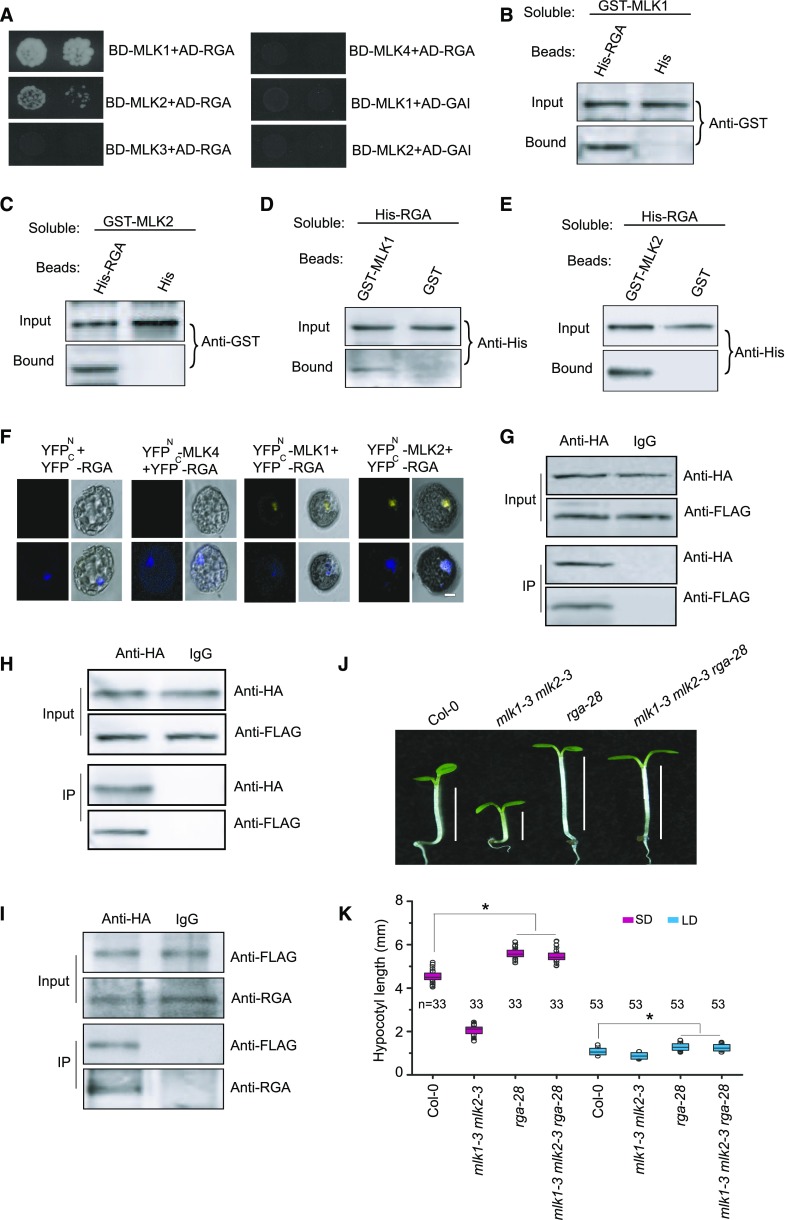
(A) Yeast two-hybrid analysis revealing an interaction between MLK1/2 and RGA. The growth of two concentrations (2 × 10⁻² and 2 × 10⁻³) of yeast cultured on synthetic defined medium lacking Trp, Leu, His, and adenine is shown.
(B) and (C) Pull-down assays with MLK1/2 and RGA. Beads containing His-tag (His) or His-fused RGA were assayed for their ability to bind soluble GST-fused MLK1/2. The input or bound protein was detected using an anti-GST antibody.
(D) and (E) Reciprocal pull-down assays with MLK1/2 and RGA. Beads containing GST tag or GST-fused MLK1/2 were assessed for their ability to bind soluble His-fused RGA and detected with an anti-His antibody.
(F) BiFC with MLK1/2 and RGA. MLK1/2 fused to the N terminus of YFP or MLK4 fused to the N terminus of YFP or the N terminus of YFP alone were tested for their ability to bind to the C terminus of YFP fused to RGA. Yellow fluorescence and a bright-field image were recorded and the resulting images were merged. Twenty-five cells were examined for each transformation. Bar = 10 µm.
(G) and (H) Co-IP of MLK1/2 and RGA. FLAG-MLK1/2 and HA-RGA were cotransformed into Arabidopsis protoplasts, immunoprecipitated using an anti-HA antibody, and detected with anti-FLAG and anti-HA antibodies. The cells were harvested at 2 h after lights-on zeitgeber time (ZT2).
(I) Co-IP of MLK2 and RGA in complemented plants. The cell extracts from 10-d-old seedlings were immunoprecipitated using an anti-FLAG antibody and detected with anti-FLAG and anti-RGA antibodies. The seedlings were harvested at 2 h after lights-on zeitgeber time (ZT2).
(J) Representative images of Col-0, rga-28, mlk1 mlk2, and mlk1 mlk2 rga28 under SD conditions. The hypocotyl lengths are indicated with lines.
(K) Hypocotyl lengths of Col-0, rga-28, mlk1 mlk2, and mlk1 mlk2 rga28 plants under SD and LD. Means ± sd obtained from independent plants. Asterisks indicate significant difference using Student’s t test (P < 0.05).

