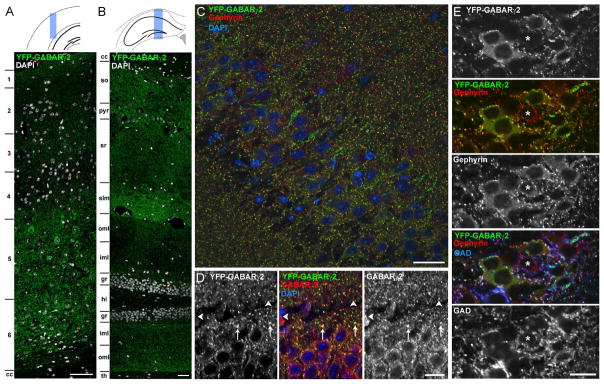
Figure 1. Transgenic HFY-GABAARγ2 Localizes to GABAergic Synapses.
HFY-GABAARγ2 localization was assessed by confocal microscopy of the YFP signal in relation to immunofluorescence for inhibitory synaptic markers in perfused adult mouse brain sections. Panels (A–D) show co-staining for nuclear DAPI. Panels (C–E) are from the hippocampal CA1 region.
(A and B) Composite images through the cortex (A) and hippocampus (B) show widespread expression and punctate distribution of HFY-GABAARγ2. Regions: 1–6, cortical layers; cc, corpus callosum; so, stratum oriens; pyr, stratum pyramidale; sr, stratum radiatum; slm, stratum lacunosum moleculare; oml, outer molecular layer; iml inner molecular layer; gr, granule cell layer; hi, hilus; th, thalamus.
(C) HFY-GABAARγ2 puncta show good colocalization with the postsynaptic inhibitory scaffold gephyrin.
(D) The majority of HFY-GABAARγ2 puncta overlapped with immunostained GABAARγ2 signals (arrows). However, a small subset of GABAARγ2 puncta did not show overlap with HFY-GABAARγ2 YFP signals (arrowheads), presumably from cells lacking transgene expression.
(E) HFY-GABAARγ2 puncta colocalized with gephyrin opposite GAD-labeled terminals, confirming clustering at bona fide GABAergic synapses. The majority of neurons expressed the transgene as detected by the presence of perisomatic HFY-GABAARγ2 clusters but a few neurons did not. The asterisk indicates a neuron lacking detectable transgene expression. Pixel intensity correlation analysis revealed significantly greater colocalization between the original images of HFY-GABAARγ2 and GAD65 or gephyrin than randomized images (p<0.0001, t-test, n=40–41 fields).
Scale bars, 100 μm (A and B), 50 μm (C), and 20 μm (D and E).

