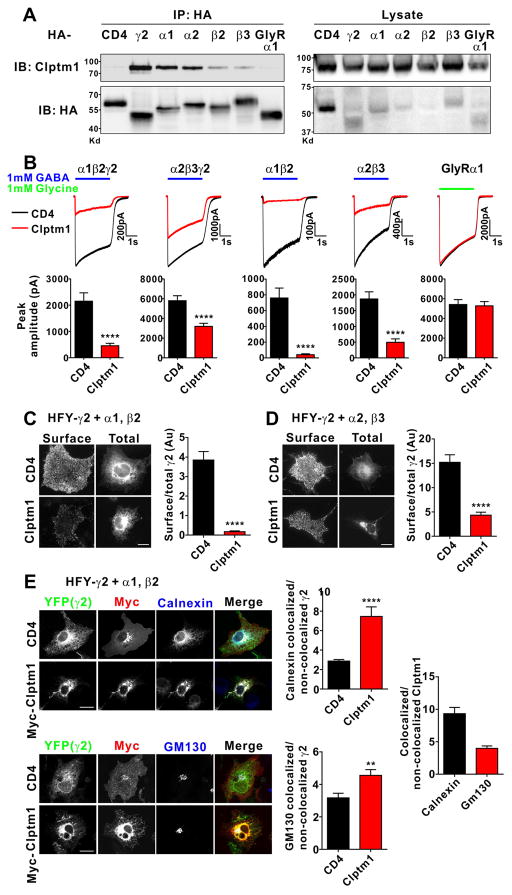
Figure 3. Clptm1 Binds Multiple GABAAR Subunits and Reduces GABAAR Mediated Currents.
(A) HEK293 cells were co-transfected with Clptm1 and HA-tagged GABAAR α1, β2, α2, β3, γ2, GlyR α1 or CD4 as a negative control. Clptm1 was specifically co-immunoprecipitated with GABAAR subunits but not GlyR α1.
(B) HEK293 cells were co-transfected with Clptm1 or HA-CD4 and GABAAR α1/β2/γ2, α2/β3/γ2, α1/β2, α2/β3, or GlyR α1, each together with GFP to detect the transfected cells for recording. GABAAR or GlyR mediated currents were induced by fast application/removal of GABA (1 mM) or glycine (1mM), respectively. Clptm1 significantly reduced GABAAR but not GlyR mediated currents. α1/β2/γ2: n=24 cells from 4 independent experiments, α2/β3/γ2: n=23 cells from 2 independent experiments, α1/β2: n=18 cells from 2 independent experiments, α2/β3: n=18 cells from 2 independent experiments, and GlyRα1: n=22 cells from 3 independent experiments. **** p<0.0001, t-test.
(C and D) COS7 cells were co-transfected with Clptm1 or HA-CD4 and HFY-GABAARγ2 with non-tagged α1/β2 (C) or α2/β3 (D). Surface HFY-GABAARγ2 was immunostained using anti-GFP antibody under non-permeabilized conditions. The surface to total HFY-GABAARγ2 ratio was reduced by Clptm1. Scale bar represents 20 μm. n=30 cells from at least 2 independent experiments. **** p<0.0001, t-test.
(E) COS7 cells co-transfected with Myc-Clptm1 or Myc-CD4 and HFY-GABAARγ2 with non-tagged α1 and β2 were fixed, permeabilized, and immunolabeled for Myc tag and the ER marker calnexin or the Golgi marker GM130. Clptm1 increased ER and Golgi localization of HFY-GABAARγ2 based on quantitation of the average intensity of YFP colocalized with calnexin or GM130 over the average intensity in the rest of the cell not colocalized with calnexin or GM130. Scale bar represents 20 μm. n=29 cells from at least 2 independent experiments. ** p<0.01, **** p<0.0001, t-test.
Results are expressed as mean ± SEM.

